Yugoslavian vs Arapaho Child Poverty Among Boys Under 16
COMPARE
Yugoslavian
Arapaho
Child Poverty Among Boys Under 16
Child Poverty Among Boys Under 16 Comparison
Yugoslavians
Arapaho
15.9%
CHILD POVERTY AMONG BOYS UNDER 16
75.9/ 100
METRIC RATING
158th/ 347
METRIC RANK
20.2%
CHILD POVERTY AMONG BOYS UNDER 16
0.0/ 100
METRIC RATING
285th/ 347
METRIC RANK
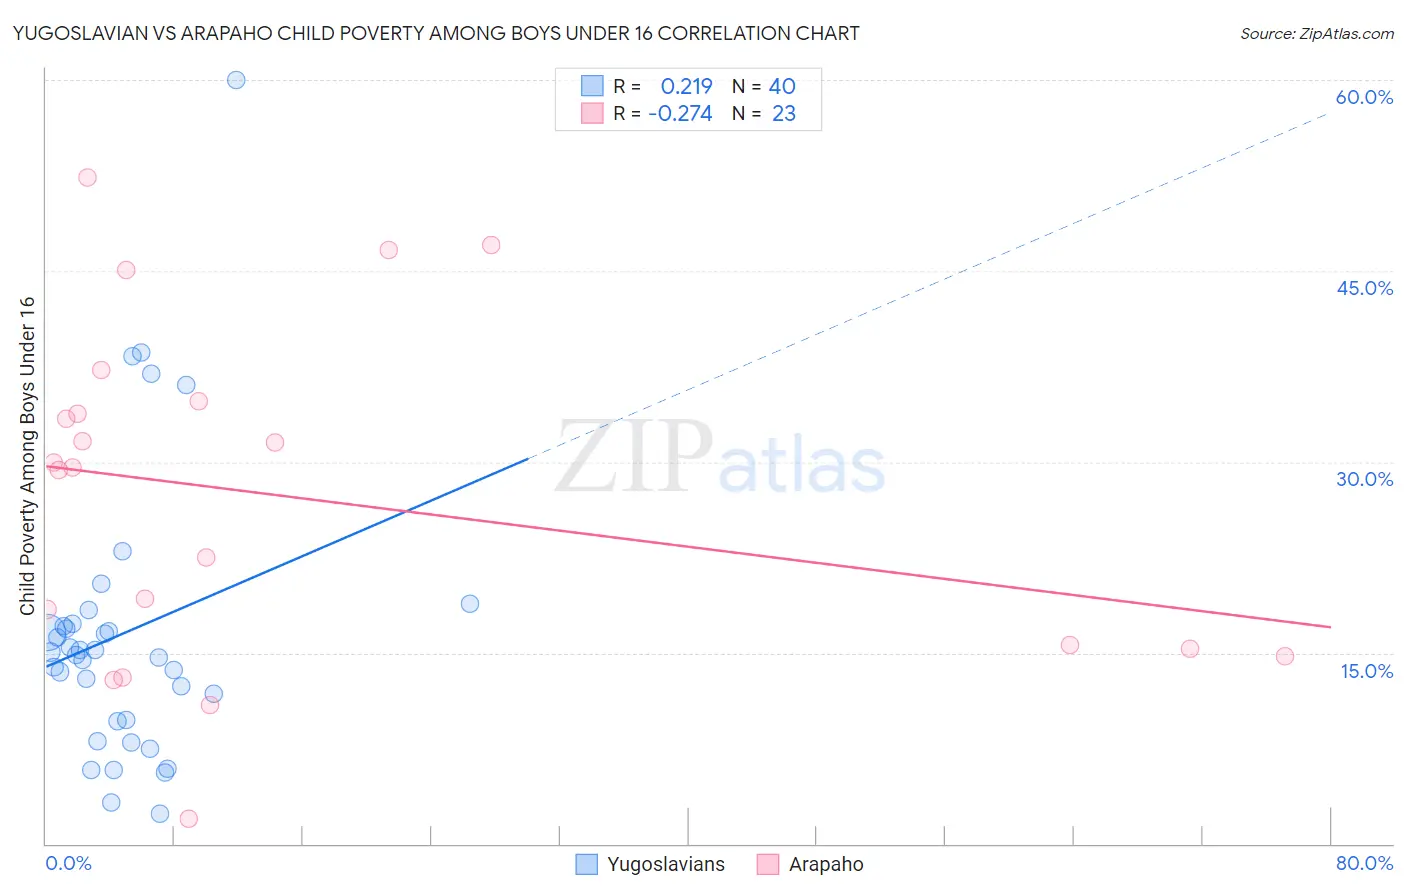
Yugoslavian vs Arapaho Child Poverty Among Boys Under 16 Correlation Chart
The statistical analysis conducted on geographies consisting of 282,204,208 people shows a weak positive correlation between the proportion of Yugoslavians and poverty level among boys under the age of 16 in the United States with a correlation coefficient (R) of 0.219 and weighted average of 15.9%. Similarly, the statistical analysis conducted on geographies consisting of 29,694,032 people shows a weak negative correlation between the proportion of Arapaho and poverty level among boys under the age of 16 in the United States with a correlation coefficient (R) of -0.274 and weighted average of 20.2%, a difference of 26.9%.
Child Poverty Among Boys Under 16 Correlation Summary
| Measurement | Yugoslavian | Arapaho |
| Minimum | 2.4% | 1.9% |
| Maximum | 60.0% | 52.3% |
| Range | 57.6% | 50.4% |
| Mean | 16.6% | 27.3% |
| Median | 14.9% | 29.6% |
| Interquartile 25% (IQ1) | 9.7% | 15.3% |
| Interquartile 75% (IQ3) | 17.2% | 34.8% |
| Interquartile Range (IQR) | 7.5% | 19.5% |
| Standard Deviation (Sample) | 11.3% | 13.4% |
| Standard Deviation (Population) | 11.1% | 13.1% |
Similar Demographics by Child Poverty Among Boys Under 16
Demographics Similar to Yugoslavians by Child Poverty Among Boys Under 16
In terms of child poverty among boys under 16, the demographic groups most similar to Yugoslavians are Immigrants from Nepal (15.9%, a difference of 0.010%), Israeli (15.9%, a difference of 0.10%), French Canadian (15.9%, a difference of 0.11%), Immigrants from Chile (15.9%, a difference of 0.17%), and Syrian (15.9%, a difference of 0.26%).
| Demographics | Rating | Rank | Child Poverty Among Boys Under 16 |
| Puget Sound Salish | 79.8 /100 | #151 | Good 15.8% |
| Immigrants | Venezuela | 79.5 /100 | #152 | Good 15.8% |
| French | 78.7 /100 | #153 | Good 15.8% |
| Syrians | 77.5 /100 | #154 | Good 15.9% |
| French Canadians | 76.6 /100 | #155 | Good 15.9% |
| Israelis | 76.5 /100 | #156 | Good 15.9% |
| Immigrants | Nepal | 76.0 /100 | #157 | Good 15.9% |
| Yugoslavians | 75.9 /100 | #158 | Good 15.9% |
| Immigrants | Chile | 74.8 /100 | #159 | Good 15.9% |
| Immigrants | Northern Africa | 71.3 /100 | #160 | Good 16.0% |
| Immigrants | Oceania | 71.3 /100 | #161 | Good 16.0% |
| Guamanians/Chamorros | 69.6 /100 | #162 | Good 16.1% |
| Costa Ricans | 68.1 /100 | #163 | Good 16.1% |
| Immigrants | Albania | 67.9 /100 | #164 | Good 16.1% |
| Colombians | 65.2 /100 | #165 | Good 16.1% |
Demographics Similar to Arapaho by Child Poverty Among Boys Under 16
In terms of child poverty among boys under 16, the demographic groups most similar to Arapaho are Barbadian (20.2%, a difference of 0.15%), West Indian (20.3%, a difference of 0.34%), Immigrants from Jamaica (20.1%, a difference of 0.38%), Immigrants from Belize (20.3%, a difference of 0.40%), and Comanche (20.1%, a difference of 0.50%).
| Demographics | Rating | Rank | Child Poverty Among Boys Under 16 |
| Immigrants | West Indies | 0.0 /100 | #278 | Tragic 20.0% |
| Bangladeshis | 0.0 /100 | #279 | Tragic 20.0% |
| Central Americans | 0.0 /100 | #280 | Tragic 20.1% |
| Immigrants | Zaire | 0.0 /100 | #281 | Tragic 20.1% |
| Comanche | 0.0 /100 | #282 | Tragic 20.1% |
| Immigrants | Jamaica | 0.0 /100 | #283 | Tragic 20.1% |
| Barbadians | 0.0 /100 | #284 | Tragic 20.2% |
| Arapaho | 0.0 /100 | #285 | Tragic 20.2% |
| West Indians | 0.0 /100 | #286 | Tragic 20.3% |
| Immigrants | Belize | 0.0 /100 | #287 | Tragic 20.3% |
| Immigrants | St. Vincent and the Grenadines | 0.0 /100 | #288 | Tragic 20.3% |
| Blackfeet | 0.0 /100 | #289 | Tragic 20.4% |
| Senegalese | 0.0 /100 | #290 | Tragic 20.6% |
| Immigrants | Latin America | 0.0 /100 | #291 | Tragic 20.6% |
| Yaqui | 0.0 /100 | #292 | Tragic 20.7% |