Yaqui vs Zimbabwean Disability Age 5 to 17
COMPARE
Yaqui
Zimbabwean
Disability Age 5 to 17
Disability Age 5 to 17 Comparison
Yaqui
Zimbabweans
6.2%
DISABILITY AGE 5 TO 17
0.0/ 100
METRIC RATING
289th/ 347
METRIC RANK
5.5%
DISABILITY AGE 5 TO 17
67.2/ 100
METRIC RATING
162nd/ 347
METRIC RANK
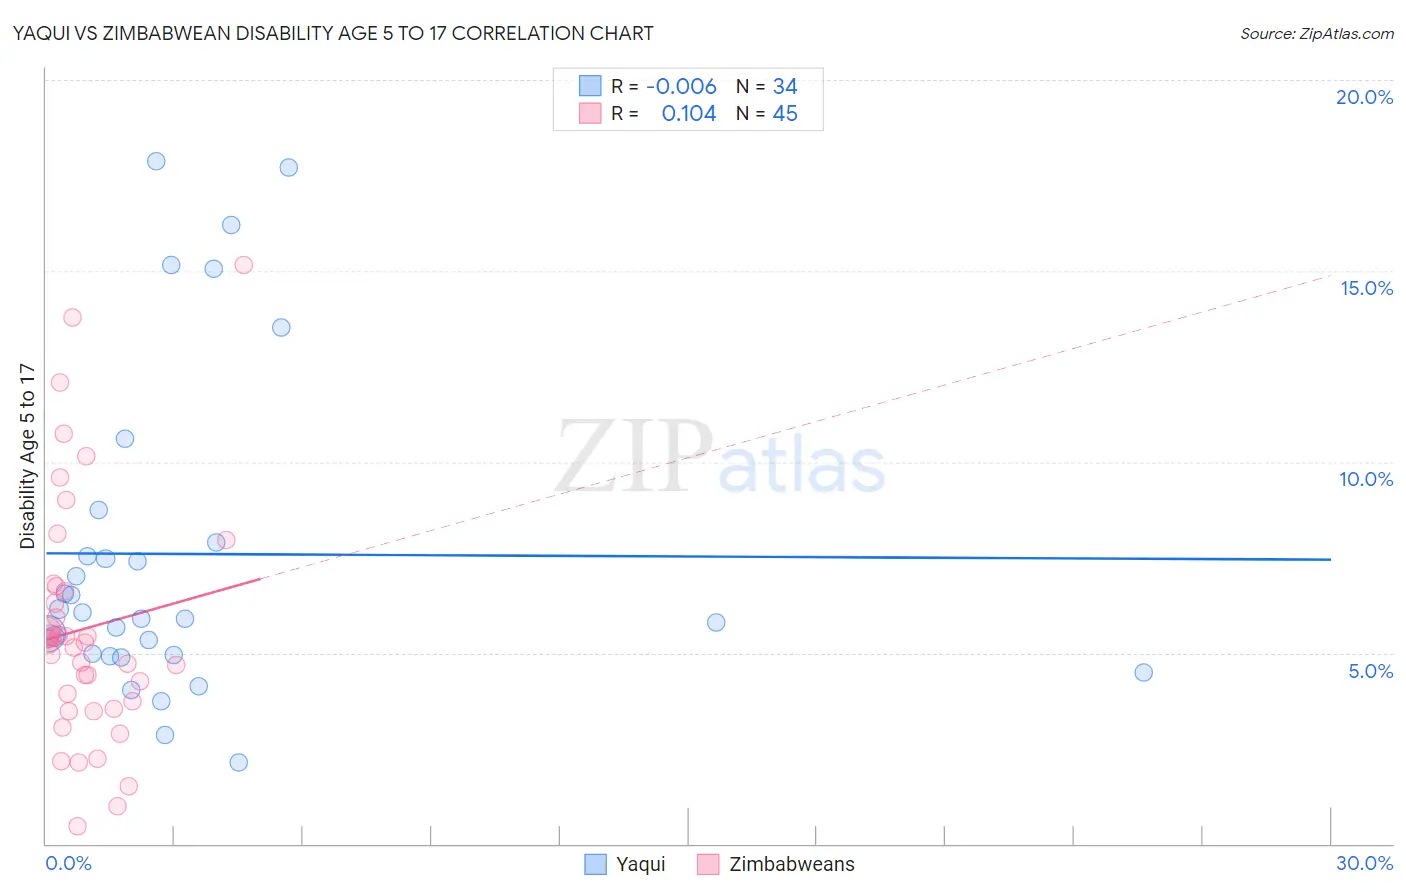
Yaqui vs Zimbabwean Disability Age 5 to 17 Correlation Chart
The statistical analysis conducted on geographies consisting of 107,446,571 people shows no correlation between the proportion of Yaqui and percentage of population with a disability between the ages 5 and 17 in the United States with a correlation coefficient (R) of -0.006 and weighted average of 6.2%. Similarly, the statistical analysis conducted on geographies consisting of 69,117,127 people shows a poor positive correlation between the proportion of Zimbabweans and percentage of population with a disability between the ages 5 and 17 in the United States with a correlation coefficient (R) of 0.104 and weighted average of 5.5%, a difference of 11.5%.
Disability Age 5 to 17 Correlation Summary
| Measurement | Yaqui | Zimbabwean |
| Minimum | 2.1% | 0.47% |
| Maximum | 17.9% | 15.2% |
| Range | 15.7% | 14.7% |
| Mean | 7.6% | 5.6% |
| Median | 6.0% | 5.3% |
| Interquartile 25% (IQ1) | 4.9% | 3.6% |
| Interquartile 75% (IQ3) | 7.9% | 6.7% |
| Interquartile Range (IQR) | 2.9% | 3.1% |
| Standard Deviation (Sample) | 4.3% | 3.1% |
| Standard Deviation (Population) | 4.2% | 3.1% |
Similar Demographics by Disability Age 5 to 17
Demographics Similar to Yaqui by Disability Age 5 to 17
In terms of disability age 5 to 17, the demographic groups most similar to Yaqui are Immigrants from Congo (6.2%, a difference of 0.0%), Jamaican (6.2%, a difference of 0.010%), White/Caucasian (6.2%, a difference of 0.15%), Pima (6.2%, a difference of 0.27%), and Immigrants from Senegal (6.2%, a difference of 0.39%).
| Demographics | Rating | Rank | Disability Age 5 to 17 |
| Germans | 0.0 /100 | #282 | Tragic 6.1% |
| Ugandans | 0.0 /100 | #283 | Tragic 6.2% |
| Sub-Saharan Africans | 0.0 /100 | #284 | Tragic 6.2% |
| English | 0.0 /100 | #285 | Tragic 6.2% |
| Colville | 0.0 /100 | #286 | Tragic 6.2% |
| Pima | 0.0 /100 | #287 | Tragic 6.2% |
| Jamaicans | 0.0 /100 | #288 | Tragic 6.2% |
| Yaqui | 0.0 /100 | #289 | Tragic 6.2% |
| Immigrants | Congo | 0.0 /100 | #290 | Tragic 6.2% |
| Whites/Caucasians | 0.0 /100 | #291 | Tragic 6.2% |
| Immigrants | Senegal | 0.0 /100 | #292 | Tragic 6.2% |
| Central American Indians | 0.0 /100 | #293 | Tragic 6.2% |
| Irish | 0.0 /100 | #294 | Tragic 6.2% |
| Cree | 0.0 /100 | #295 | Tragic 6.2% |
| Spanish Americans | 0.0 /100 | #296 | Tragic 6.2% |
Demographics Similar to Zimbabweans by Disability Age 5 to 17
In terms of disability age 5 to 17, the demographic groups most similar to Zimbabweans are Immigrants from Saudi Arabia (5.5%, a difference of 0.11%), Immigrants from Southern Europe (5.6%, a difference of 0.18%), Immigrants from Scotland (5.6%, a difference of 0.29%), Lebanese (5.6%, a difference of 0.31%), and Greek (5.6%, a difference of 0.36%).
| Demographics | Rating | Rank | Disability Age 5 to 17 |
| Immigrants | Ecuador | 78.3 /100 | #155 | Good 5.5% |
| Hawaiians | 78.0 /100 | #156 | Good 5.5% |
| Immigrants | Costa Rica | 77.9 /100 | #157 | Good 5.5% |
| Immigrants | Nepal | 77.1 /100 | #158 | Good 5.5% |
| Immigrants | Zimbabwe | 75.3 /100 | #159 | Good 5.5% |
| South Africans | 73.3 /100 | #160 | Good 5.5% |
| Immigrants | Saudi Arabia | 69.1 /100 | #161 | Good 5.5% |
| Zimbabweans | 67.2 /100 | #162 | Good 5.5% |
| Immigrants | Southern Europe | 64.0 /100 | #163 | Good 5.6% |
| Immigrants | Scotland | 61.9 /100 | #164 | Good 5.6% |
| Lebanese | 61.4 /100 | #165 | Good 5.6% |
| Greeks | 60.6 /100 | #166 | Good 5.6% |
| Immigrants | Burma/Myanmar | 59.3 /100 | #167 | Average 5.6% |
| Iraqis | 56.0 /100 | #168 | Average 5.6% |
| Immigrants | Norway | 55.7 /100 | #169 | Average 5.6% |