Navajo vs Immigrants from North Macedonia Female Disability
COMPARE
Navajo
Immigrants from North Macedonia
Female Disability
Female Disability Comparison
Navajo
Immigrants from North Macedonia
14.2%
FEMALE DISABILITY
0.0/ 100
METRIC RATING
325th/ 347
METRIC RANK
11.8%
FEMALE DISABILITY
96.8/ 100
METRIC RATING
122nd/ 347
METRIC RANK
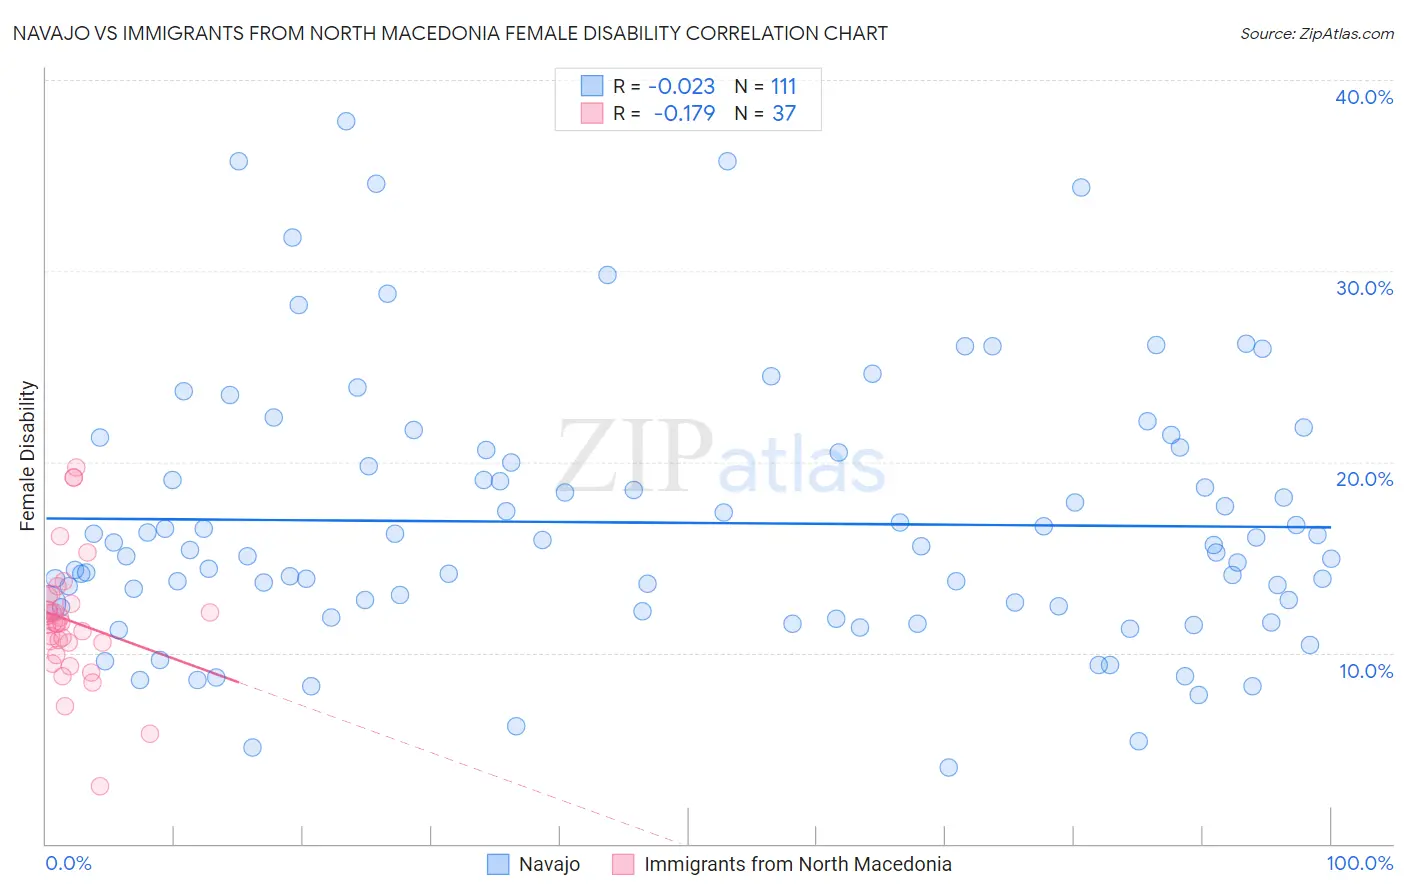
Navajo vs Immigrants from North Macedonia Female Disability Correlation Chart
The statistical analysis conducted on geographies consisting of 224,768,780 people shows no correlation between the proportion of Navajo and percentage of females with a disability in the United States with a correlation coefficient (R) of -0.023 and weighted average of 14.2%. Similarly, the statistical analysis conducted on geographies consisting of 74,311,700 people shows a poor negative correlation between the proportion of Immigrants from North Macedonia and percentage of females with a disability in the United States with a correlation coefficient (R) of -0.179 and weighted average of 11.8%, a difference of 20.0%.
Female Disability Correlation Summary
| Measurement | Navajo | Immigrants from North Macedonia |
| Minimum | 4.0% | 3.0% |
| Maximum | 37.8% | 19.7% |
| Range | 33.8% | 16.7% |
| Mean | 16.8% | 11.7% |
| Median | 15.4% | 11.6% |
| Interquartile 25% (IQ1) | 12.5% | 10.2% |
| Interquartile 75% (IQ3) | 20.5% | 12.8% |
| Interquartile Range (IQR) | 8.0% | 2.6% |
| Standard Deviation (Sample) | 6.9% | 3.3% |
| Standard Deviation (Population) | 6.9% | 3.3% |
Similar Demographics by Female Disability
Demographics Similar to Navajo by Female Disability
In terms of female disability, the demographic groups most similar to Navajo are Comanche (14.2%, a difference of 0.11%), Native/Alaskan (14.1%, a difference of 0.14%), Black/African American (14.1%, a difference of 0.16%), Pueblo (14.1%, a difference of 0.32%), and Potawatomi (14.1%, a difference of 0.33%).
| Demographics | Rating | Rank | Female Disability |
| Paiute | 0.0 /100 | #318 | Tragic 14.0% |
| Iroquois | 0.0 /100 | #319 | Tragic 14.0% |
| Americans | 0.0 /100 | #320 | Tragic 14.1% |
| Potawatomi | 0.0 /100 | #321 | Tragic 14.1% |
| Pueblo | 0.0 /100 | #322 | Tragic 14.1% |
| Blacks/African Americans | 0.0 /100 | #323 | Tragic 14.1% |
| Natives/Alaskans | 0.0 /100 | #324 | Tragic 14.1% |
| Navajo | 0.0 /100 | #325 | Tragic 14.2% |
| Comanche | 0.0 /100 | #326 | Tragic 14.2% |
| Ottawa | 0.0 /100 | #327 | Tragic 14.2% |
| Cape Verdeans | 0.0 /100 | #328 | Tragic 14.2% |
| Osage | 0.0 /100 | #329 | Tragic 14.3% |
| Yuman | 0.0 /100 | #330 | Tragic 14.5% |
| Immigrants | Cabo Verde | 0.0 /100 | #331 | Tragic 14.6% |
| Pima | 0.0 /100 | #332 | Tragic 14.8% |
Demographics Similar to Immigrants from North Macedonia by Female Disability
In terms of female disability, the demographic groups most similar to Immigrants from North Macedonia are Immigrants from Netherlands (11.8%, a difference of 0.010%), Immigrants from Kazakhstan (11.8%, a difference of 0.040%), Immigrants from Croatia (11.8%, a difference of 0.050%), Russian (11.8%, a difference of 0.10%), and Immigrants from Eastern Europe (11.8%, a difference of 0.12%).
| Demographics | Rating | Rank | Female Disability |
| Brazilians | 97.7 /100 | #115 | Exceptional 11.8% |
| Immigrants | Morocco | 97.6 /100 | #116 | Exceptional 11.8% |
| Immigrants | Eastern Europe | 97.2 /100 | #117 | Exceptional 11.8% |
| Immigrants | Nigeria | 97.2 /100 | #118 | Exceptional 11.8% |
| Immigrants | Uganda | 97.2 /100 | #119 | Exceptional 11.8% |
| Immigrants | Kazakhstan | 97.0 /100 | #120 | Exceptional 11.8% |
| Immigrants | Netherlands | 96.9 /100 | #121 | Exceptional 11.8% |
| Immigrants | North Macedonia | 96.8 /100 | #122 | Exceptional 11.8% |
| Immigrants | Croatia | 96.7 /100 | #123 | Exceptional 11.8% |
| Russians | 96.5 /100 | #124 | Exceptional 11.8% |
| Immigrants | Italy | 96.4 /100 | #125 | Exceptional 11.8% |
| Immigrants | Europe | 96.2 /100 | #126 | Exceptional 11.8% |
| South American Indians | 95.8 /100 | #127 | Exceptional 11.8% |
| Immigrants | Latvia | 95.6 /100 | #128 | Exceptional 11.8% |
| Macedonians | 95.5 /100 | #129 | Exceptional 11.8% |