Yakama vs Immigrants from Trinidad and Tobago Vision Disability
COMPARE
Yakama
Immigrants from Trinidad and Tobago
Vision Disability
Vision Disability Comparison
Yakama
Immigrants from Trinidad and Tobago
2.5%
VISION DISABILITY
0.0/ 100
METRIC RATING
284th/ 347
METRIC RANK
2.3%
VISION DISABILITY
6.1/ 100
METRIC RATING
216th/ 347
METRIC RANK
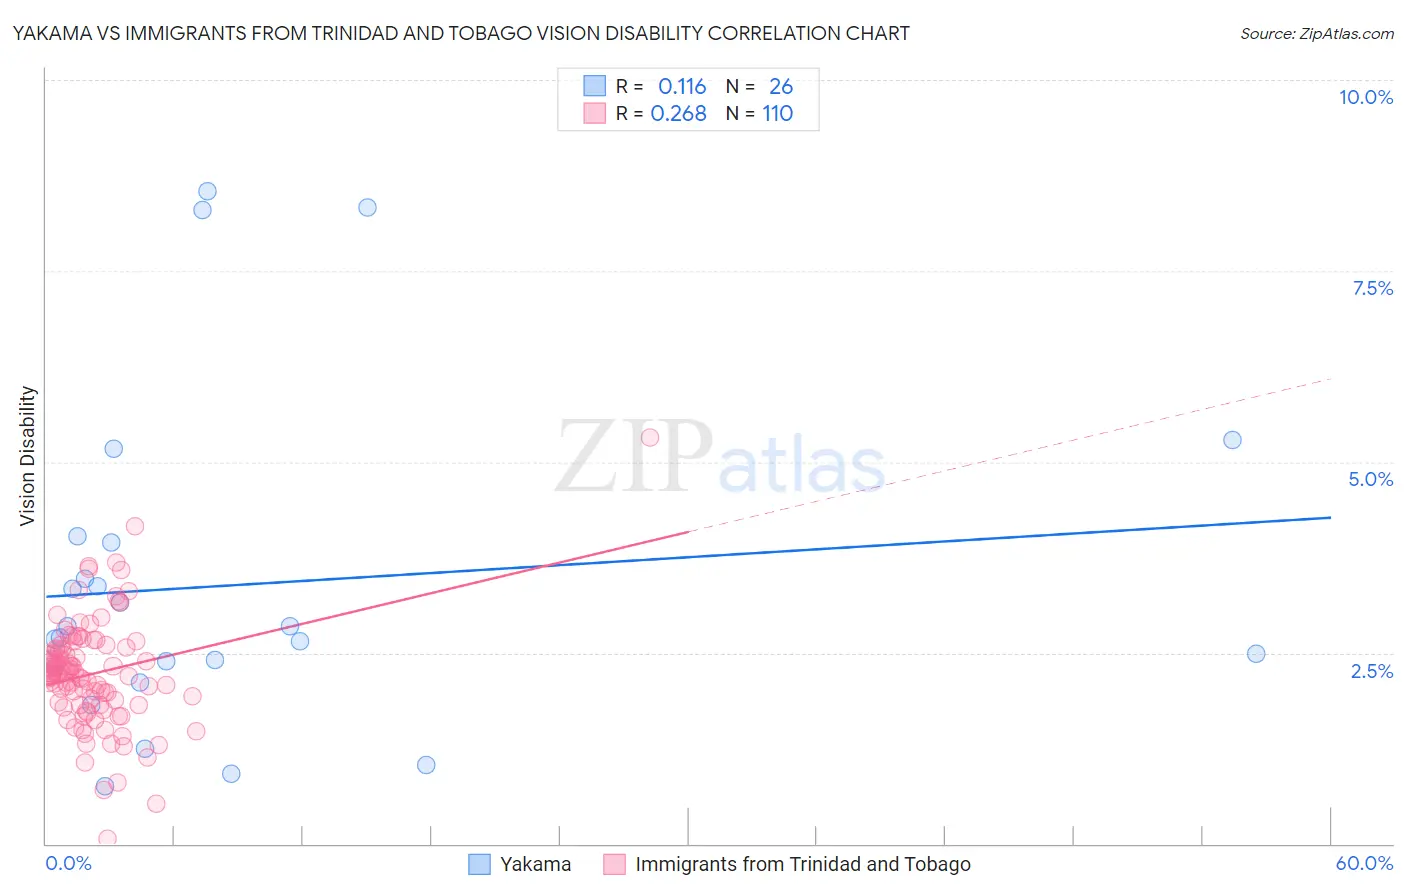
Yakama vs Immigrants from Trinidad and Tobago Vision Disability Correlation Chart
The statistical analysis conducted on geographies consisting of 19,916,701 people shows a poor positive correlation between the proportion of Yakama and percentage of population with vision disability in the United States with a correlation coefficient (R) of 0.116 and weighted average of 2.5%. Similarly, the statistical analysis conducted on geographies consisting of 223,458,050 people shows a weak positive correlation between the proportion of Immigrants from Trinidad and Tobago and percentage of population with vision disability in the United States with a correlation coefficient (R) of 0.268 and weighted average of 2.3%, a difference of 9.1%.
Vision Disability Correlation Summary
| Measurement | Yakama | Immigrants from Trinidad and Tobago |
| Minimum | 0.75% | 0.061% |
| Maximum | 8.5% | 5.3% |
| Range | 7.8% | 5.3% |
| Mean | 3.4% | 2.2% |
| Median | 2.8% | 2.2% |
| Interquartile 25% (IQ1) | 2.4% | 1.8% |
| Interquartile 75% (IQ3) | 3.9% | 2.6% |
| Interquartile Range (IQR) | 1.6% | 0.74% |
| Standard Deviation (Sample) | 2.2% | 0.72% |
| Standard Deviation (Population) | 2.1% | 0.72% |
Similar Demographics by Vision Disability
Demographics Similar to Yakama by Vision Disability
In terms of vision disability, the demographic groups most similar to Yakama are Immigrants from Central America (2.5%, a difference of 0.010%), Sioux (2.5%, a difference of 0.030%), Honduran (2.5%, a difference of 0.17%), French American Indian (2.5%, a difference of 0.19%), and Puget Sound Salish (2.5%, a difference of 0.28%).
| Demographics | Rating | Rank | Vision Disability |
| Bahamians | 0.0 /100 | #277 | Tragic 2.4% |
| Spanish | 0.0 /100 | #278 | Tragic 2.4% |
| Nepalese | 0.0 /100 | #279 | Tragic 2.4% |
| Cape Verdeans | 0.0 /100 | #280 | Tragic 2.4% |
| U.S. Virgin Islanders | 0.0 /100 | #281 | Tragic 2.5% |
| Immigrants | Caribbean | 0.0 /100 | #282 | Tragic 2.5% |
| Puget Sound Salish | 0.0 /100 | #283 | Tragic 2.5% |
| Yakama | 0.0 /100 | #284 | Tragic 2.5% |
| Immigrants | Central America | 0.0 /100 | #285 | Tragic 2.5% |
| Sioux | 0.0 /100 | #286 | Tragic 2.5% |
| Hondurans | 0.0 /100 | #287 | Tragic 2.5% |
| French American Indians | 0.0 /100 | #288 | Tragic 2.5% |
| Immigrants | Nonimmigrants | 0.0 /100 | #289 | Tragic 2.5% |
| Immigrants | Cuba | 0.0 /100 | #290 | Tragic 2.5% |
| Immigrants | Honduras | 0.0 /100 | #291 | Tragic 2.5% |
Demographics Similar to Immigrants from Trinidad and Tobago by Vision Disability
In terms of vision disability, the demographic groups most similar to Immigrants from Trinidad and Tobago are Barbadian (2.3%, a difference of 0.28%), Nigerian (2.3%, a difference of 0.29%), Portuguese (2.3%, a difference of 0.34%), Ecuadorian (2.3%, a difference of 0.45%), and Trinidadian and Tobagonian (2.2%, a difference of 0.50%).
| Demographics | Rating | Rank | Vision Disability |
| Immigrants | Brazil | 13.1 /100 | #209 | Poor 2.2% |
| Immigrants | Uruguay | 11.5 /100 | #210 | Poor 2.2% |
| Indonesians | 9.5 /100 | #211 | Tragic 2.2% |
| Bermudans | 9.0 /100 | #212 | Tragic 2.2% |
| Immigrants | Ghana | 8.9 /100 | #213 | Tragic 2.2% |
| Trinidadians and Tobagonians | 8.2 /100 | #214 | Tragic 2.2% |
| Nigerians | 7.2 /100 | #215 | Tragic 2.3% |
| Immigrants | Trinidad and Tobago | 6.1 /100 | #216 | Tragic 2.3% |
| Barbadians | 5.1 /100 | #217 | Tragic 2.3% |
| Portuguese | 4.9 /100 | #218 | Tragic 2.3% |
| Ecuadorians | 4.6 /100 | #219 | Tragic 2.3% |
| Guamanians/Chamorros | 3.9 /100 | #220 | Tragic 2.3% |
| French Canadians | 3.9 /100 | #221 | Tragic 2.3% |
| Immigrants | Senegal | 3.8 /100 | #222 | Tragic 2.3% |
| Basques | 3.5 /100 | #223 | Tragic 2.3% |