Puerto Rican vs Immigrants from Trinidad and Tobago Vision Disability
COMPARE
Puerto Rican
Immigrants from Trinidad and Tobago
Vision Disability
Vision Disability Comparison
Puerto Ricans
Immigrants from Trinidad and Tobago
3.9%
VISION DISABILITY
0.0/ 100
METRIC RATING
347th/ 347
METRIC RANK
2.3%
VISION DISABILITY
6.1/ 100
METRIC RATING
216th/ 347
METRIC RANK
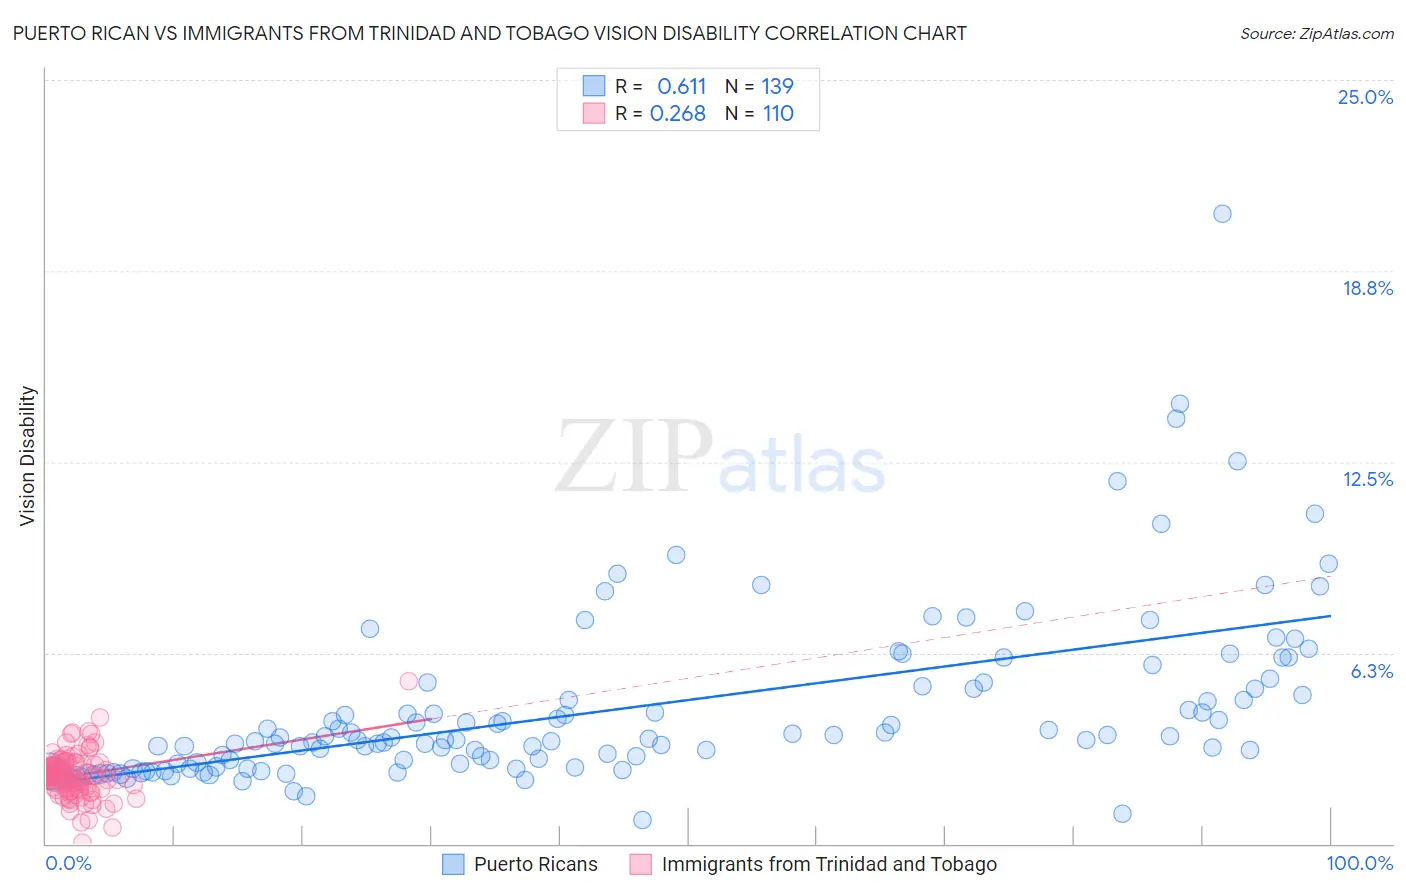
Puerto Rican vs Immigrants from Trinidad and Tobago Vision Disability Correlation Chart
The statistical analysis conducted on geographies consisting of 527,298,658 people shows a significant positive correlation between the proportion of Puerto Ricans and percentage of population with vision disability in the United States with a correlation coefficient (R) of 0.611 and weighted average of 3.9%. Similarly, the statistical analysis conducted on geographies consisting of 223,458,050 people shows a weak positive correlation between the proportion of Immigrants from Trinidad and Tobago and percentage of population with vision disability in the United States with a correlation coefficient (R) of 0.268 and weighted average of 2.3%, a difference of 71.6%.
Vision Disability Correlation Summary
| Measurement | Puerto Rican | Immigrants from Trinidad and Tobago |
| Minimum | 0.78% | 0.061% |
| Maximum | 20.6% | 5.3% |
| Range | 19.8% | 5.3% |
| Mean | 4.4% | 2.2% |
| Median | 3.4% | 2.2% |
| Interquartile 25% (IQ1) | 2.5% | 1.8% |
| Interquartile 75% (IQ3) | 5.1% | 2.6% |
| Interquartile Range (IQR) | 2.6% | 0.74% |
| Standard Deviation (Sample) | 2.9% | 0.72% |
| Standard Deviation (Population) | 2.9% | 0.72% |
Similar Demographics by Vision Disability
Demographics Similar to Puerto Ricans by Vision Disability
In terms of vision disability, the demographic groups most similar to Puerto Ricans are Houma (3.4%, a difference of 12.7%), Lumbee (3.4%, a difference of 14.5%), Pueblo (3.3%, a difference of 16.4%), Pima (3.3%, a difference of 16.4%), and Choctaw (3.3%, a difference of 17.6%).
| Demographics | Rating | Rank | Vision Disability |
| Cajuns | 0.0 /100 | #333 | Tragic 3.1% |
| Cheyenne | 0.0 /100 | #334 | Tragic 3.1% |
| Navajo | 0.0 /100 | #335 | Tragic 3.1% |
| Alaskan Athabascans | 0.0 /100 | #336 | Tragic 3.1% |
| Dutch West Indians | 0.0 /100 | #337 | Tragic 3.2% |
| Chickasaw | 0.0 /100 | #338 | Tragic 3.2% |
| Tsimshian | 0.0 /100 | #339 | Tragic 3.2% |
| Creek | 0.0 /100 | #340 | Tragic 3.2% |
| Kiowa | 0.0 /100 | #341 | Tragic 3.3% |
| Choctaw | 0.0 /100 | #342 | Tragic 3.3% |
| Pima | 0.0 /100 | #343 | Tragic 3.3% |
| Pueblo | 0.0 /100 | #344 | Tragic 3.3% |
| Lumbee | 0.0 /100 | #345 | Tragic 3.4% |
| Houma | 0.0 /100 | #346 | Tragic 3.4% |
| Puerto Ricans | 0.0 /100 | #347 | Tragic 3.9% |
Demographics Similar to Immigrants from Trinidad and Tobago by Vision Disability
In terms of vision disability, the demographic groups most similar to Immigrants from Trinidad and Tobago are Barbadian (2.3%, a difference of 0.28%), Nigerian (2.3%, a difference of 0.29%), Portuguese (2.3%, a difference of 0.34%), Ecuadorian (2.3%, a difference of 0.45%), and Trinidadian and Tobagonian (2.2%, a difference of 0.50%).
| Demographics | Rating | Rank | Vision Disability |
| Immigrants | Brazil | 13.1 /100 | #209 | Poor 2.2% |
| Immigrants | Uruguay | 11.5 /100 | #210 | Poor 2.2% |
| Indonesians | 9.5 /100 | #211 | Tragic 2.2% |
| Bermudans | 9.0 /100 | #212 | Tragic 2.2% |
| Immigrants | Ghana | 8.9 /100 | #213 | Tragic 2.2% |
| Trinidadians and Tobagonians | 8.2 /100 | #214 | Tragic 2.2% |
| Nigerians | 7.2 /100 | #215 | Tragic 2.3% |
| Immigrants | Trinidad and Tobago | 6.1 /100 | #216 | Tragic 2.3% |
| Barbadians | 5.1 /100 | #217 | Tragic 2.3% |
| Portuguese | 4.9 /100 | #218 | Tragic 2.3% |
| Ecuadorians | 4.6 /100 | #219 | Tragic 2.3% |
| Guamanians/Chamorros | 3.9 /100 | #220 | Tragic 2.3% |
| French Canadians | 3.9 /100 | #221 | Tragic 2.3% |
| Immigrants | Senegal | 3.8 /100 | #222 | Tragic 2.3% |
| Basques | 3.5 /100 | #223 | Tragic 2.3% |