Yakama vs Immigrants from El Salvador Vision Disability
COMPARE
Yakama
Immigrants from El Salvador
Vision Disability
Vision Disability Comparison
Yakama
Immigrants from El Salvador
2.5%
VISION DISABILITY
0.0/ 100
METRIC RATING
284th/ 347
METRIC RANK
2.2%
VISION DISABILITY
21.0/ 100
METRIC RATING
199th/ 347
METRIC RANK
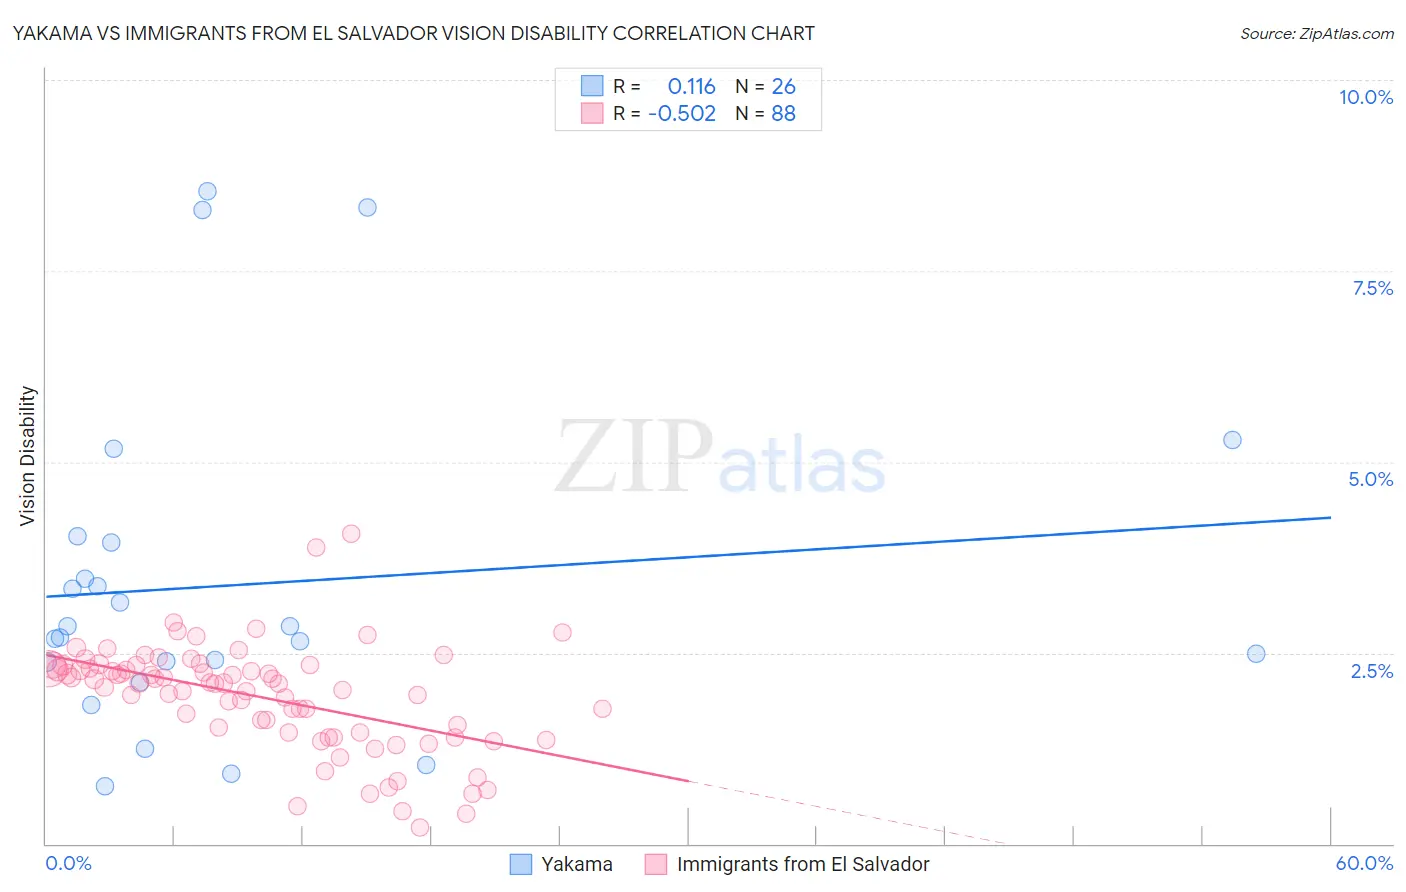
Yakama vs Immigrants from El Salvador Vision Disability Correlation Chart
The statistical analysis conducted on geographies consisting of 19,916,701 people shows a poor positive correlation between the proportion of Yakama and percentage of population with vision disability in the United States with a correlation coefficient (R) of 0.116 and weighted average of 2.5%. Similarly, the statistical analysis conducted on geographies consisting of 357,605,888 people shows a substantial negative correlation between the proportion of Immigrants from El Salvador and percentage of population with vision disability in the United States with a correlation coefficient (R) of -0.502 and weighted average of 2.2%, a difference of 11.5%.
Vision Disability Correlation Summary
| Measurement | Yakama | Immigrants from El Salvador |
| Minimum | 0.75% | 0.21% |
| Maximum | 8.5% | 4.1% |
| Range | 7.8% | 3.9% |
| Mean | 3.4% | 1.9% |
| Median | 2.8% | 2.1% |
| Interquartile 25% (IQ1) | 2.4% | 1.5% |
| Interquartile 75% (IQ3) | 3.9% | 2.3% |
| Interquartile Range (IQR) | 1.6% | 0.86% |
| Standard Deviation (Sample) | 2.2% | 0.70% |
| Standard Deviation (Population) | 2.1% | 0.69% |
Similar Demographics by Vision Disability
Demographics Similar to Yakama by Vision Disability
In terms of vision disability, the demographic groups most similar to Yakama are Immigrants from Central America (2.5%, a difference of 0.010%), Sioux (2.5%, a difference of 0.030%), Honduran (2.5%, a difference of 0.17%), French American Indian (2.5%, a difference of 0.19%), and Puget Sound Salish (2.5%, a difference of 0.28%).
| Demographics | Rating | Rank | Vision Disability |
| Bahamians | 0.0 /100 | #277 | Tragic 2.4% |
| Spanish | 0.0 /100 | #278 | Tragic 2.4% |
| Nepalese | 0.0 /100 | #279 | Tragic 2.4% |
| Cape Verdeans | 0.0 /100 | #280 | Tragic 2.4% |
| U.S. Virgin Islanders | 0.0 /100 | #281 | Tragic 2.5% |
| Immigrants | Caribbean | 0.0 /100 | #282 | Tragic 2.5% |
| Puget Sound Salish | 0.0 /100 | #283 | Tragic 2.5% |
| Yakama | 0.0 /100 | #284 | Tragic 2.5% |
| Immigrants | Central America | 0.0 /100 | #285 | Tragic 2.5% |
| Sioux | 0.0 /100 | #286 | Tragic 2.5% |
| Hondurans | 0.0 /100 | #287 | Tragic 2.5% |
| French American Indians | 0.0 /100 | #288 | Tragic 2.5% |
| Immigrants | Nonimmigrants | 0.0 /100 | #289 | Tragic 2.5% |
| Immigrants | Cuba | 0.0 /100 | #290 | Tragic 2.5% |
| Immigrants | Honduras | 0.0 /100 | #291 | Tragic 2.5% |
Demographics Similar to Immigrants from El Salvador by Vision Disability
In terms of vision disability, the demographic groups most similar to Immigrants from El Salvador are Czechoslovakian (2.2%, a difference of 0.050%), Ghanaian (2.2%, a difference of 0.070%), Immigrants from Thailand (2.2%, a difference of 0.090%), Immigrants from Grenada (2.2%, a difference of 0.18%), and Slovak (2.2%, a difference of 0.21%).
| Demographics | Rating | Rank | Vision Disability |
| Europeans | 25.7 /100 | #192 | Fair 2.2% |
| British | 25.1 /100 | #193 | Fair 2.2% |
| Immigrants | Barbados | 24.0 /100 | #194 | Fair 2.2% |
| Immigrants | Immigrants | 23.7 /100 | #195 | Fair 2.2% |
| Immigrants | Grenada | 23.1 /100 | #196 | Fair 2.2% |
| Ghanaians | 21.8 /100 | #197 | Fair 2.2% |
| Czechoslovakians | 21.6 /100 | #198 | Fair 2.2% |
| Immigrants | El Salvador | 21.0 /100 | #199 | Fair 2.2% |
| Immigrants | Thailand | 20.1 /100 | #200 | Fair 2.2% |
| Slovaks | 18.8 /100 | #201 | Poor 2.2% |
| Immigrants | Zaire | 18.0 /100 | #202 | Poor 2.2% |
| Dutch | 17.1 /100 | #203 | Poor 2.2% |
| Immigrants | Guyana | 15.9 /100 | #204 | Poor 2.2% |
| Samoans | 15.7 /100 | #205 | Poor 2.2% |
| Pennsylvania Germans | 14.5 /100 | #206 | Poor 2.2% |