Tongan vs Immigrants from Trinidad and Tobago Vision Disability
COMPARE
Tongan
Immigrants from Trinidad and Tobago
Vision Disability
Vision Disability Comparison
Tongans
Immigrants from Trinidad and Tobago
2.0%
VISION DISABILITY
99.5/ 100
METRIC RATING
51st/ 347
METRIC RANK
2.3%
VISION DISABILITY
6.1/ 100
METRIC RATING
216th/ 347
METRIC RANK
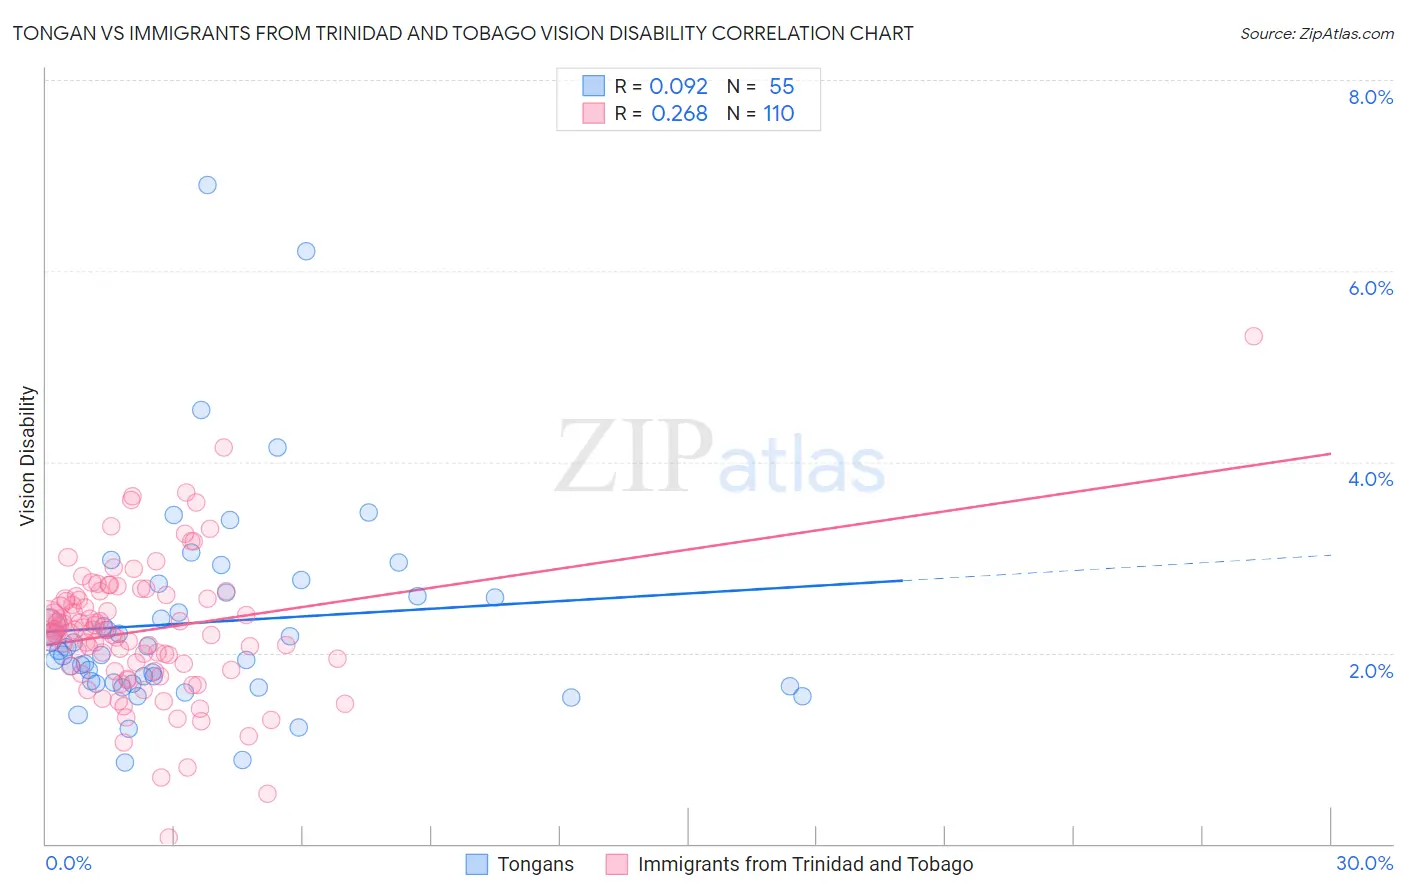
Tongan vs Immigrants from Trinidad and Tobago Vision Disability Correlation Chart
The statistical analysis conducted on geographies consisting of 102,891,232 people shows a slight positive correlation between the proportion of Tongans and percentage of population with vision disability in the United States with a correlation coefficient (R) of 0.092 and weighted average of 2.0%. Similarly, the statistical analysis conducted on geographies consisting of 223,458,050 people shows a weak positive correlation between the proportion of Immigrants from Trinidad and Tobago and percentage of population with vision disability in the United States with a correlation coefficient (R) of 0.268 and weighted average of 2.3%, a difference of 13.8%.
Vision Disability Correlation Summary
| Measurement | Tongan | Immigrants from Trinidad and Tobago |
| Minimum | 0.85% | 0.061% |
| Maximum | 6.9% | 5.3% |
| Range | 6.1% | 5.3% |
| Mean | 2.3% | 2.2% |
| Median | 2.0% | 2.2% |
| Interquartile 25% (IQ1) | 1.7% | 1.8% |
| Interquartile 75% (IQ3) | 2.6% | 2.6% |
| Interquartile Range (IQR) | 0.96% | 0.74% |
| Standard Deviation (Sample) | 1.1% | 0.72% |
| Standard Deviation (Population) | 1.1% | 0.72% |
Similar Demographics by Vision Disability
Demographics Similar to Tongans by Vision Disability
In terms of vision disability, the demographic groups most similar to Tongans are Afghan (2.0%, a difference of 0.090%), Latvian (2.0%, a difference of 0.15%), Israeli (2.0%, a difference of 0.22%), Immigrants from Serbia (2.0%, a difference of 0.31%), and Immigrants from Belarus (2.0%, a difference of 0.42%).
| Demographics | Rating | Rank | Vision Disability |
| Immigrants | Indonesia | 99.7 /100 | #44 | Exceptional 2.0% |
| Ethiopians | 99.7 /100 | #45 | Exceptional 2.0% |
| Immigrants | Sweden | 99.7 /100 | #46 | Exceptional 2.0% |
| Immigrants | Bulgaria | 99.7 /100 | #47 | Exceptional 2.0% |
| Israelis | 99.6 /100 | #48 | Exceptional 2.0% |
| Latvians | 99.5 /100 | #49 | Exceptional 2.0% |
| Afghans | 99.5 /100 | #50 | Exceptional 2.0% |
| Tongans | 99.5 /100 | #51 | Exceptional 2.0% |
| Immigrants | Serbia | 99.4 /100 | #52 | Exceptional 2.0% |
| Immigrants | Belarus | 99.3 /100 | #53 | Exceptional 2.0% |
| Macedonians | 99.3 /100 | #54 | Exceptional 2.0% |
| Laotians | 99.3 /100 | #55 | Exceptional 2.0% |
| Jordanians | 99.2 /100 | #56 | Exceptional 2.0% |
| Somalis | 99.2 /100 | #57 | Exceptional 2.0% |
| Immigrants | Saudi Arabia | 99.2 /100 | #58 | Exceptional 2.0% |
Demographics Similar to Immigrants from Trinidad and Tobago by Vision Disability
In terms of vision disability, the demographic groups most similar to Immigrants from Trinidad and Tobago are Barbadian (2.3%, a difference of 0.28%), Nigerian (2.3%, a difference of 0.29%), Portuguese (2.3%, a difference of 0.34%), Ecuadorian (2.3%, a difference of 0.45%), and Trinidadian and Tobagonian (2.2%, a difference of 0.50%).
| Demographics | Rating | Rank | Vision Disability |
| Immigrants | Brazil | 13.1 /100 | #209 | Poor 2.2% |
| Immigrants | Uruguay | 11.5 /100 | #210 | Poor 2.2% |
| Indonesians | 9.5 /100 | #211 | Tragic 2.2% |
| Bermudans | 9.0 /100 | #212 | Tragic 2.2% |
| Immigrants | Ghana | 8.9 /100 | #213 | Tragic 2.2% |
| Trinidadians and Tobagonians | 8.2 /100 | #214 | Tragic 2.2% |
| Nigerians | 7.2 /100 | #215 | Tragic 2.3% |
| Immigrants | Trinidad and Tobago | 6.1 /100 | #216 | Tragic 2.3% |
| Barbadians | 5.1 /100 | #217 | Tragic 2.3% |
| Portuguese | 4.9 /100 | #218 | Tragic 2.3% |
| Ecuadorians | 4.6 /100 | #219 | Tragic 2.3% |
| Guamanians/Chamorros | 3.9 /100 | #220 | Tragic 2.3% |
| French Canadians | 3.9 /100 | #221 | Tragic 2.3% |
| Immigrants | Senegal | 3.8 /100 | #222 | Tragic 2.3% |
| Basques | 3.5 /100 | #223 | Tragic 2.3% |