Yakama vs Austrian Vision Disability
COMPARE
Yakama
Austrian
Vision Disability
Vision Disability Comparison
Yakama
Austrians
2.5%
VISION DISABILITY
0.0/ 100
METRIC RATING
284th/ 347
METRIC RANK
2.1%
VISION DISABILITY
69.0/ 100
METRIC RATING
160th/ 347
METRIC RANK
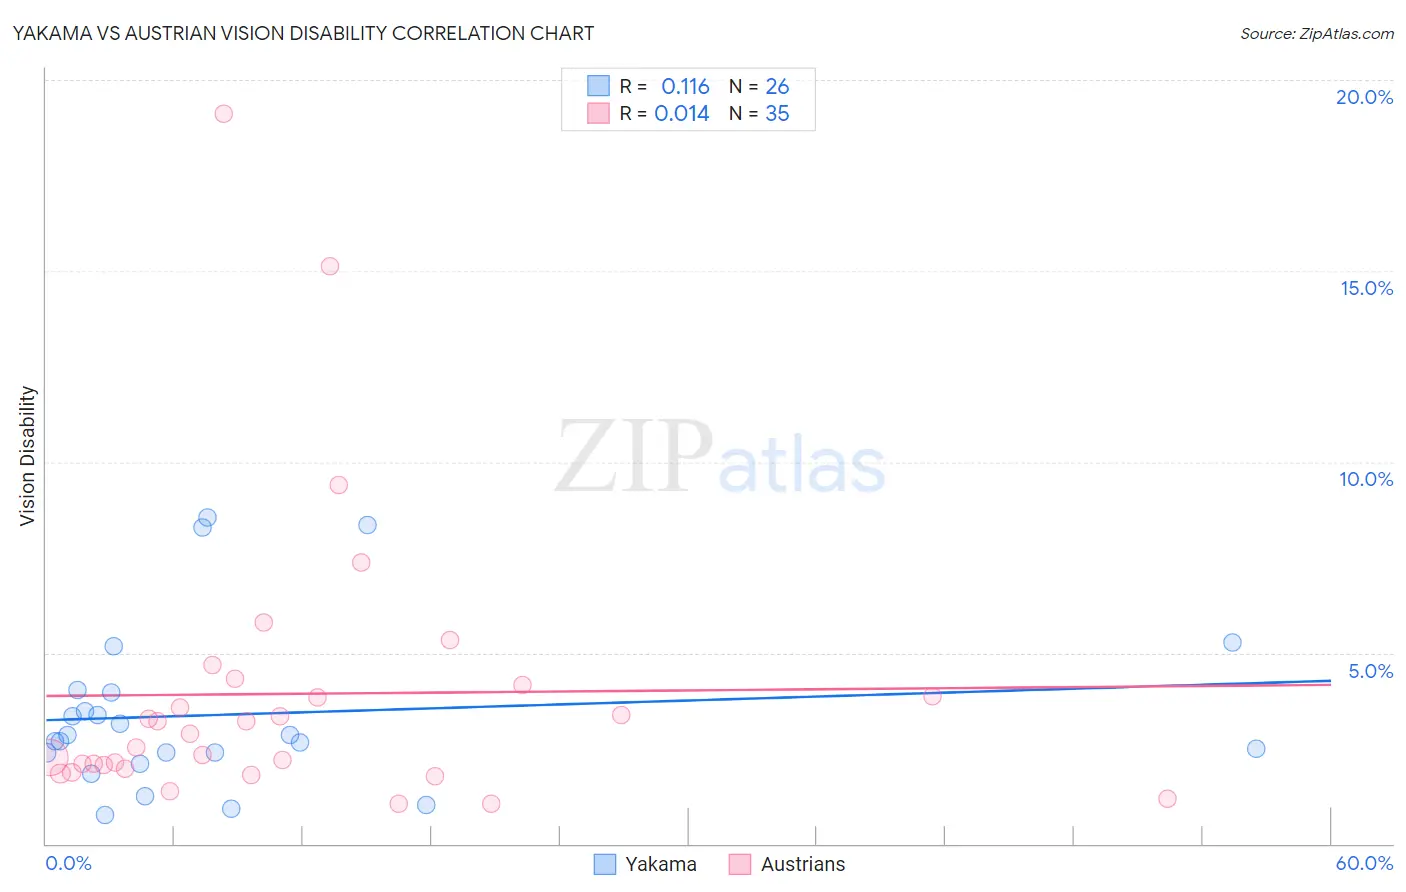
Yakama vs Austrian Vision Disability Correlation Chart
The statistical analysis conducted on geographies consisting of 19,916,701 people shows a poor positive correlation between the proportion of Yakama and percentage of population with vision disability in the United States with a correlation coefficient (R) of 0.116 and weighted average of 2.5%. Similarly, the statistical analysis conducted on geographies consisting of 451,572,198 people shows no correlation between the proportion of Austrians and percentage of population with vision disability in the United States with a correlation coefficient (R) of 0.014 and weighted average of 2.1%, a difference of 15.2%.
Vision Disability Correlation Summary
| Measurement | Yakama | Austrian |
| Minimum | 0.75% | 1.0% |
| Maximum | 8.5% | 19.1% |
| Range | 7.8% | 18.1% |
| Mean | 3.4% | 3.9% |
| Median | 2.8% | 2.9% |
| Interquartile 25% (IQ1) | 2.4% | 2.0% |
| Interquartile 75% (IQ3) | 3.9% | 4.2% |
| Interquartile Range (IQR) | 1.6% | 2.2% |
| Standard Deviation (Sample) | 2.2% | 3.8% |
| Standard Deviation (Population) | 2.1% | 3.7% |
Similar Demographics by Vision Disability
Demographics Similar to Yakama by Vision Disability
In terms of vision disability, the demographic groups most similar to Yakama are Immigrants from Central America (2.5%, a difference of 0.010%), Sioux (2.5%, a difference of 0.030%), Honduran (2.5%, a difference of 0.17%), French American Indian (2.5%, a difference of 0.19%), and Puget Sound Salish (2.5%, a difference of 0.28%).
| Demographics | Rating | Rank | Vision Disability |
| Bahamians | 0.0 /100 | #277 | Tragic 2.4% |
| Spanish | 0.0 /100 | #278 | Tragic 2.4% |
| Nepalese | 0.0 /100 | #279 | Tragic 2.4% |
| Cape Verdeans | 0.0 /100 | #280 | Tragic 2.4% |
| U.S. Virgin Islanders | 0.0 /100 | #281 | Tragic 2.5% |
| Immigrants | Caribbean | 0.0 /100 | #282 | Tragic 2.5% |
| Puget Sound Salish | 0.0 /100 | #283 | Tragic 2.5% |
| Yakama | 0.0 /100 | #284 | Tragic 2.5% |
| Immigrants | Central America | 0.0 /100 | #285 | Tragic 2.5% |
| Sioux | 0.0 /100 | #286 | Tragic 2.5% |
| Hondurans | 0.0 /100 | #287 | Tragic 2.5% |
| French American Indians | 0.0 /100 | #288 | Tragic 2.5% |
| Immigrants | Nonimmigrants | 0.0 /100 | #289 | Tragic 2.5% |
| Immigrants | Cuba | 0.0 /100 | #290 | Tragic 2.5% |
| Immigrants | Honduras | 0.0 /100 | #291 | Tragic 2.5% |
Demographics Similar to Austrians by Vision Disability
In terms of vision disability, the demographic groups most similar to Austrians are South African (2.1%, a difference of 0.060%), Immigrants from Uzbekistan (2.1%, a difference of 0.070%), Serbian (2.1%, a difference of 0.090%), Iraqi (2.1%, a difference of 0.090%), and Hungarian (2.1%, a difference of 0.12%).
| Demographics | Rating | Rank | Vision Disability |
| Immigrants | South America | 73.8 /100 | #153 | Good 2.1% |
| Slovenes | 73.6 /100 | #154 | Good 2.1% |
| Immigrants | Colombia | 72.1 /100 | #155 | Good 2.1% |
| Pakistanis | 71.6 /100 | #156 | Good 2.1% |
| Serbians | 70.2 /100 | #157 | Good 2.1% |
| Immigrants | Uzbekistan | 69.9 /100 | #158 | Good 2.1% |
| South Africans | 69.8 /100 | #159 | Good 2.1% |
| Austrians | 69.0 /100 | #160 | Good 2.1% |
| Iraqis | 67.7 /100 | #161 | Good 2.1% |
| Hungarians | 67.4 /100 | #162 | Good 2.1% |
| Icelanders | 66.1 /100 | #163 | Good 2.1% |
| Immigrants | Bangladesh | 65.5 /100 | #164 | Good 2.1% |
| Immigrants | Iraq | 64.8 /100 | #165 | Good 2.1% |
| Immigrants | England | 62.8 /100 | #166 | Good 2.1% |
| Immigrants | Africa | 62.6 /100 | #167 | Good 2.1% |