Immigrants from Venezuela vs Immigrants from Fiji Disability
COMPARE
Immigrants from Venezuela
Immigrants from Fiji
Disability
Disability Comparison
Immigrants from Venezuela
Immigrants from Fiji
10.4%
DISABILITY
100.0/ 100
METRIC RATING
20th/ 347
METRIC RANK
11.6%
DISABILITY
69.5/ 100
METRIC RATING
156th/ 347
METRIC RANK
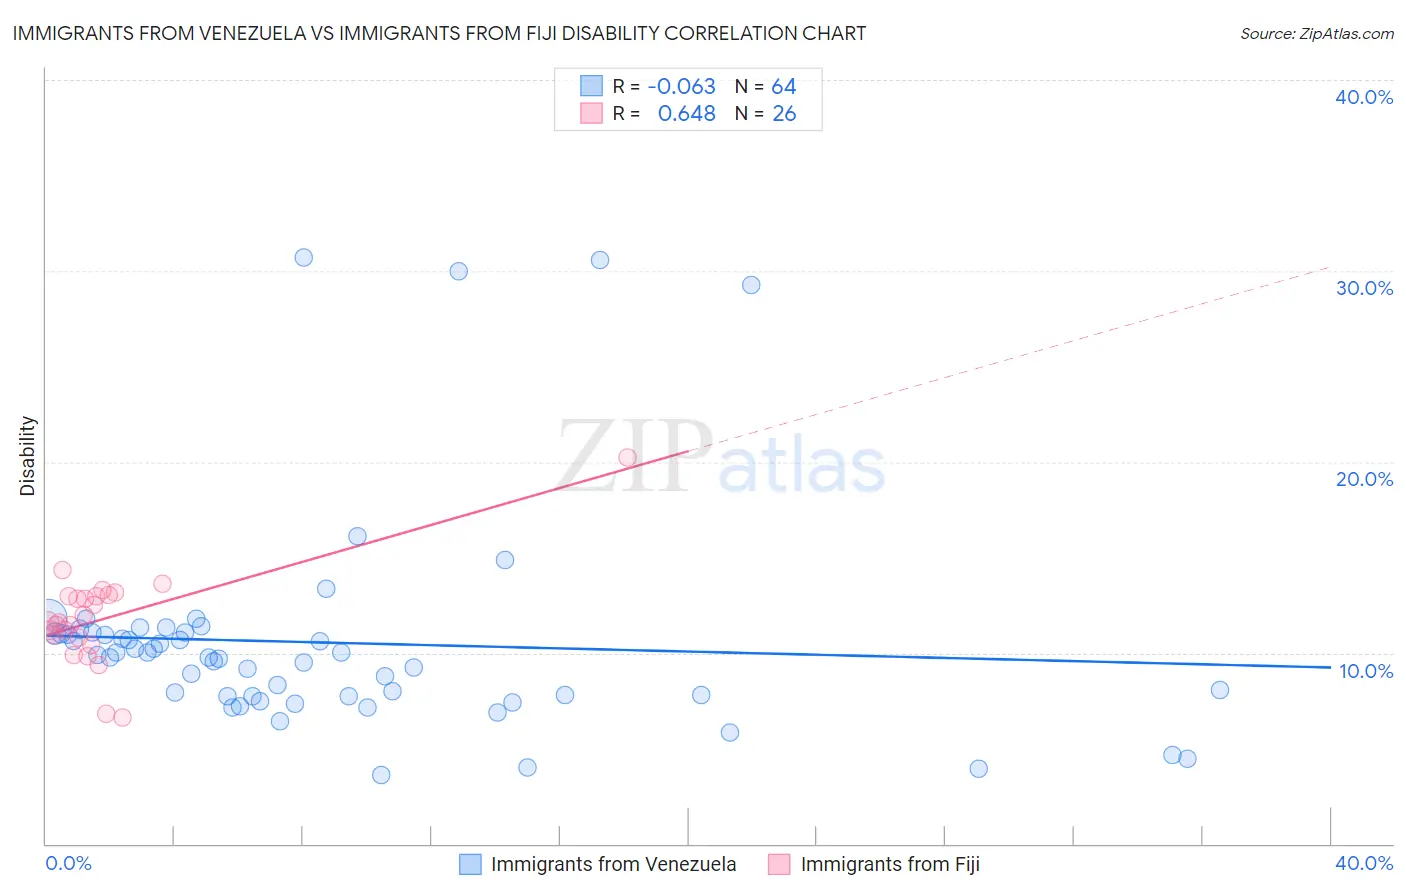
Immigrants from Venezuela vs Immigrants from Fiji Disability Correlation Chart
The statistical analysis conducted on geographies consisting of 287,858,715 people shows a slight negative correlation between the proportion of Immigrants from Venezuela and percentage of population with a disability in the United States with a correlation coefficient (R) of -0.063 and weighted average of 10.4%. Similarly, the statistical analysis conducted on geographies consisting of 93,755,847 people shows a significant positive correlation between the proportion of Immigrants from Fiji and percentage of population with a disability in the United States with a correlation coefficient (R) of 0.648 and weighted average of 11.6%, a difference of 11.0%.
Disability Correlation Summary
| Measurement | Immigrants from Venezuela | Immigrants from Fiji |
| Minimum | 3.6% | 6.6% |
| Maximum | 30.7% | 20.2% |
| Range | 27.2% | 13.6% |
| Mean | 10.5% | 11.8% |
| Median | 9.8% | 11.6% |
| Interquartile 25% (IQ1) | 7.7% | 10.8% |
| Interquartile 75% (IQ3) | 11.0% | 13.0% |
| Interquartile Range (IQR) | 3.3% | 2.2% |
| Standard Deviation (Sample) | 5.6% | 2.5% |
| Standard Deviation (Population) | 5.6% | 2.5% |
Similar Demographics by Disability
Demographics Similar to Immigrants from Venezuela by Disability
In terms of disability, the demographic groups most similar to Immigrants from Venezuela are Asian (10.4%, a difference of 0.030%), Immigrants from Sri Lanka (10.5%, a difference of 0.13%), Immigrants from Pakistan (10.4%, a difference of 0.69%), Burmese (10.4%, a difference of 0.70%), and Immigrants from Asia (10.5%, a difference of 0.82%).
| Demographics | Rating | Rank | Disability |
| Immigrants | Eastern Asia | 100.0 /100 | #13 | Exceptional 10.2% |
| Immigrants | Korea | 100.0 /100 | #14 | Exceptional 10.2% |
| Okinawans | 100.0 /100 | #15 | Exceptional 10.3% |
| Indians (Asian) | 100.0 /100 | #16 | Exceptional 10.3% |
| Immigrants | Iran | 100.0 /100 | #17 | Exceptional 10.3% |
| Burmese | 100.0 /100 | #18 | Exceptional 10.4% |
| Immigrants | Pakistan | 100.0 /100 | #19 | Exceptional 10.4% |
| Immigrants | Venezuela | 100.0 /100 | #20 | Exceptional 10.4% |
| Asians | 100.0 /100 | #21 | Exceptional 10.4% |
| Immigrants | Sri Lanka | 100.0 /100 | #22 | Exceptional 10.5% |
| Immigrants | Asia | 100.0 /100 | #23 | Exceptional 10.5% |
| Venezuelans | 100.0 /100 | #24 | Exceptional 10.5% |
| Immigrants | Malaysia | 100.0 /100 | #25 | Exceptional 10.6% |
| Argentineans | 100.0 /100 | #26 | Exceptional 10.6% |
| Cypriots | 100.0 /100 | #27 | Exceptional 10.6% |
Demographics Similar to Immigrants from Fiji by Disability
In terms of disability, the demographic groups most similar to Immigrants from Fiji are Immigrants from Middle Africa (11.6%, a difference of 0.0%), Immigrants from Netherlands (11.6%, a difference of 0.010%), Immigrants from Ghana (11.6%, a difference of 0.090%), Immigrants from Guatemala (11.6%, a difference of 0.090%), and Immigrants from Kenya (11.6%, a difference of 0.14%).
| Demographics | Rating | Rank | Disability |
| Immigrants | Norway | 73.2 /100 | #149 | Good 11.6% |
| Romanians | 72.7 /100 | #150 | Good 11.6% |
| Immigrants | Kenya | 72.1 /100 | #151 | Good 11.6% |
| Immigrants | Moldova | 72.0 /100 | #152 | Good 11.6% |
| Immigrants | Ghana | 71.2 /100 | #153 | Good 11.6% |
| Immigrants | Guatemala | 71.1 /100 | #154 | Good 11.6% |
| Immigrants | Netherlands | 69.8 /100 | #155 | Good 11.6% |
| Immigrants | Fiji | 69.5 /100 | #156 | Good 11.6% |
| Immigrants | Middle Africa | 69.5 /100 | #157 | Good 11.6% |
| Armenians | 65.9 /100 | #158 | Good 11.6% |
| Guatemalans | 65.1 /100 | #159 | Good 11.6% |
| Immigrants | Barbados | 64.2 /100 | #160 | Good 11.6% |
| Immigrants | Cuba | 62.8 /100 | #161 | Good 11.6% |
| Immigrants | Haiti | 59.2 /100 | #162 | Average 11.7% |
| Immigrants | Trinidad and Tobago | 58.9 /100 | #163 | Average 11.7% |