Immigrants from Middle Africa vs Dutch West Indian Disability Age Under 5
COMPARE
Immigrants from Middle Africa
Dutch West Indian
Disability Age Under 5
Disability Age Under 5 Comparison
Immigrants from Middle Africa
Dutch West Indians
1.2%
DISABILITY AGE UNDER 5
79.3/ 100
METRIC RATING
144th/ 347
METRIC RANK
1.9%
DISABILITY AGE UNDER 5
0.0/ 100
METRIC RATING
333rd/ 347
METRIC RANK
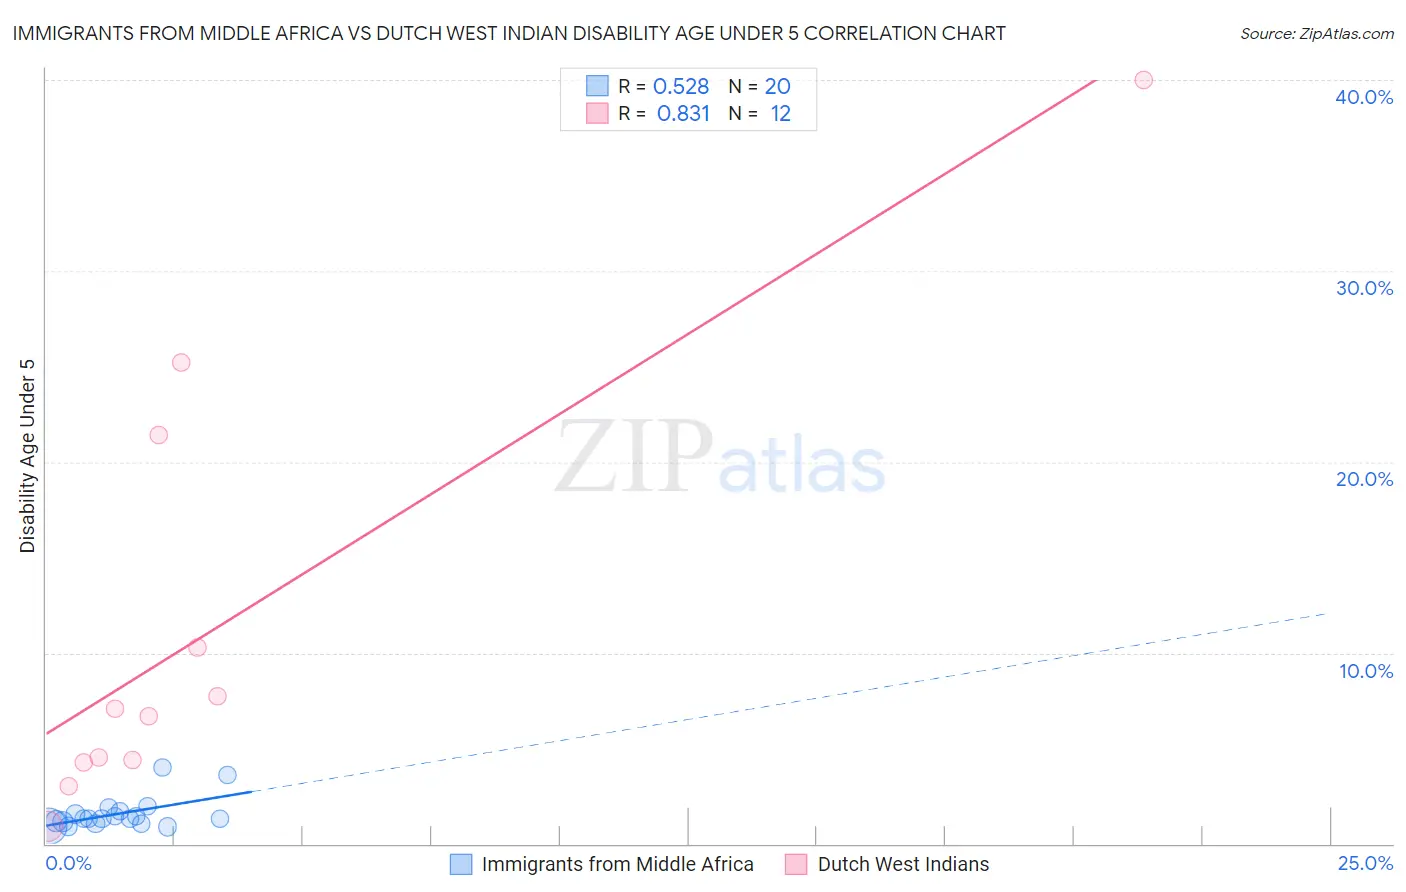
Immigrants from Middle Africa vs Dutch West Indian Disability Age Under 5 Correlation Chart
The statistical analysis conducted on geographies consisting of 135,378,258 people shows a substantial positive correlation between the proportion of Immigrants from Middle Africa and percentage of population with a disability under the age of 5 in the United States with a correlation coefficient (R) of 0.528 and weighted average of 1.2%. Similarly, the statistical analysis conducted on geographies consisting of 63,691,358 people shows a very strong positive correlation between the proportion of Dutch West Indians and percentage of population with a disability under the age of 5 in the United States with a correlation coefficient (R) of 0.831 and weighted average of 1.9%, a difference of 60.9%.
Disability Age Under 5 Correlation Summary
| Measurement | Immigrants from Middle Africa | Dutch West Indian |
| Minimum | 0.88% | 0.90% |
| Maximum | 4.0% | 40.0% |
| Range | 3.1% | 39.1% |
| Mean | 1.6% | 11.3% |
| Median | 1.3% | 6.9% |
| Interquartile 25% (IQ1) | 1.1% | 4.3% |
| Interquartile 75% (IQ3) | 1.6% | 15.9% |
| Interquartile Range (IQR) | 0.53% | 11.5% |
| Standard Deviation (Sample) | 0.82% | 11.6% |
| Standard Deviation (Population) | 0.80% | 11.2% |
Similar Demographics by Disability Age Under 5
Demographics Similar to Immigrants from Middle Africa by Disability Age Under 5
In terms of disability age under 5, the demographic groups most similar to Immigrants from Middle Africa are Alsatian (1.2%, a difference of 0.0%), Immigrants from Colombia (1.2%, a difference of 0.010%), Immigrants from Honduras (1.2%, a difference of 0.16%), Immigrants from Zimbabwe (1.2%, a difference of 0.18%), and Somali (1.2%, a difference of 0.22%).
| Demographics | Rating | Rank | Disability Age Under 5 |
| Immigrants | Eastern Africa | 83.1 /100 | #137 | Excellent 1.2% |
| Immigrants | Czechoslovakia | 82.8 /100 | #138 | Excellent 1.2% |
| New Zealanders | 81.4 /100 | #139 | Excellent 1.2% |
| Somalis | 80.8 /100 | #140 | Excellent 1.2% |
| Immigrants | Honduras | 80.4 /100 | #141 | Excellent 1.2% |
| Immigrants | Colombia | 79.3 /100 | #142 | Good 1.2% |
| Alsatians | 79.3 /100 | #143 | Good 1.2% |
| Immigrants | Middle Africa | 79.3 /100 | #144 | Good 1.2% |
| Immigrants | Zimbabwe | 77.9 /100 | #145 | Good 1.2% |
| Samoans | 77.7 /100 | #146 | Good 1.2% |
| Icelanders | 76.3 /100 | #147 | Good 1.2% |
| Ghanaians | 76.3 /100 | #148 | Good 1.2% |
| Kenyans | 75.9 /100 | #149 | Good 1.2% |
| South Americans | 75.6 /100 | #150 | Good 1.2% |
| Yaqui | 74.8 /100 | #151 | Good 1.2% |
Demographics Similar to Dutch West Indians by Disability Age Under 5
In terms of disability age under 5, the demographic groups most similar to Dutch West Indians are Native/Alaskan (1.9%, a difference of 0.40%), Pennsylvania German (1.9%, a difference of 0.78%), Paraguayan (2.0%, a difference of 2.1%), Chippewa (1.9%, a difference of 2.9%), and French Canadian (1.9%, a difference of 3.0%).
| Demographics | Rating | Rank | Disability Age Under 5 |
| Sioux | 0.0 /100 | #326 | Tragic 1.8% |
| Osage | 0.0 /100 | #327 | Tragic 1.8% |
| Americans | 0.0 /100 | #328 | Tragic 1.9% |
| Houma | 0.0 /100 | #329 | Tragic 1.9% |
| Choctaw | 0.0 /100 | #330 | Tragic 1.9% |
| French Canadians | 0.0 /100 | #331 | Tragic 1.9% |
| Chippewa | 0.0 /100 | #332 | Tragic 1.9% |
| Dutch West Indians | 0.0 /100 | #333 | Tragic 1.9% |
| Natives/Alaskans | 0.0 /100 | #334 | Tragic 1.9% |
| Pennsylvania Germans | 0.0 /100 | #335 | Tragic 1.9% |
| Paraguayans | 0.0 /100 | #336 | Tragic 2.0% |
| Apache | 0.0 /100 | #337 | Tragic 2.0% |
| Tohono O'odham | 0.0 /100 | #338 | Tragic 2.2% |
| Immigrants | Azores | 0.0 /100 | #339 | Tragic 2.2% |
| Menominee | 0.0 /100 | #340 | Tragic 2.3% |