Ugandan vs Dutch West Indian Disability Age Under 5
COMPARE
Ugandan
Dutch West Indian
Disability Age Under 5
Disability Age Under 5 Comparison
Ugandans
Dutch West Indians
1.1%
DISABILITY AGE UNDER 5
97.5/ 100
METRIC RATING
87th/ 347
METRIC RANK
1.9%
DISABILITY AGE UNDER 5
0.0/ 100
METRIC RATING
333rd/ 347
METRIC RANK
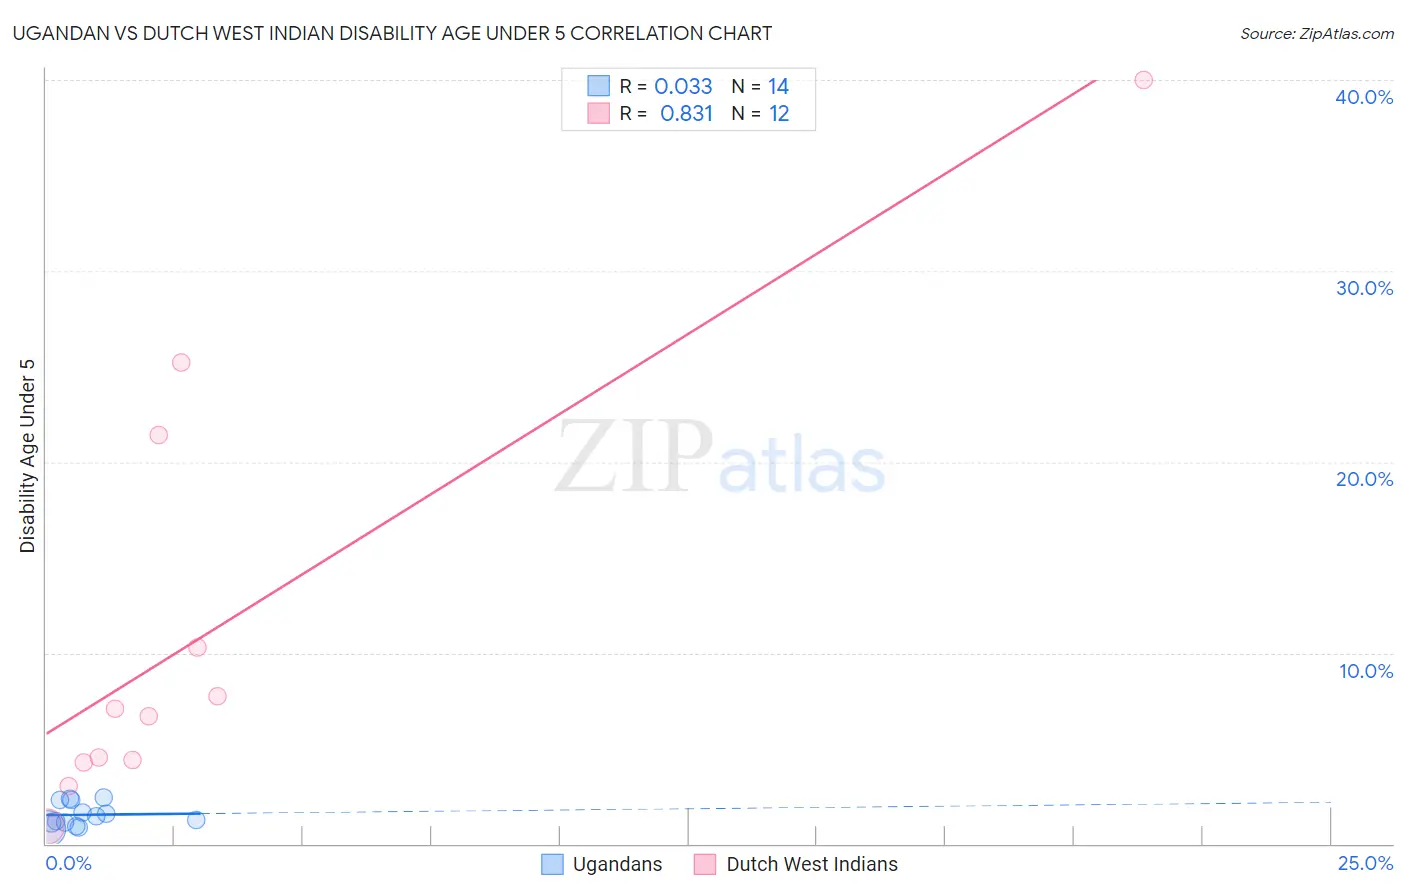
Ugandan vs Dutch West Indian Disability Age Under 5 Correlation Chart
The statistical analysis conducted on geographies consisting of 75,065,074 people shows no correlation between the proportion of Ugandans and percentage of population with a disability under the age of 5 in the United States with a correlation coefficient (R) of 0.033 and weighted average of 1.1%. Similarly, the statistical analysis conducted on geographies consisting of 63,691,358 people shows a very strong positive correlation between the proportion of Dutch West Indians and percentage of population with a disability under the age of 5 in the United States with a correlation coefficient (R) of 0.831 and weighted average of 1.9%, a difference of 70.2%.
Disability Age Under 5 Correlation Summary
| Measurement | Ugandan | Dutch West Indian |
| Minimum | 0.80% | 0.90% |
| Maximum | 2.4% | 40.0% |
| Range | 1.6% | 39.1% |
| Mean | 1.5% | 11.3% |
| Median | 1.3% | 6.9% |
| Interquartile 25% (IQ1) | 1.1% | 4.3% |
| Interquartile 75% (IQ3) | 2.3% | 15.9% |
| Interquartile Range (IQR) | 1.2% | 11.5% |
| Standard Deviation (Sample) | 0.59% | 11.6% |
| Standard Deviation (Population) | 0.57% | 11.2% |
Similar Demographics by Disability Age Under 5
Demographics Similar to Ugandans by Disability Age Under 5
In terms of disability age under 5, the demographic groups most similar to Ugandans are Okinawan (1.1%, a difference of 0.020%), Immigrants from Dominican Republic (1.1%, a difference of 0.020%), Sudanese (1.1%, a difference of 0.14%), Immigrants from Zaire (1.1%, a difference of 0.22%), and Ethiopian (1.1%, a difference of 0.31%).
| Demographics | Rating | Rank | Disability Age Under 5 |
| Immigrants | Trinidad and Tobago | 98.0 /100 | #80 | Exceptional 1.1% |
| Turks | 98.0 /100 | #81 | Exceptional 1.1% |
| Immigrants | Jordan | 97.9 /100 | #82 | Exceptional 1.1% |
| Immigrants | Syria | 97.9 /100 | #83 | Exceptional 1.1% |
| Immigrants | Zaire | 97.8 /100 | #84 | Exceptional 1.1% |
| Sudanese | 97.7 /100 | #85 | Exceptional 1.1% |
| Okinawans | 97.6 /100 | #86 | Exceptional 1.1% |
| Ugandans | 97.5 /100 | #87 | Exceptional 1.1% |
| Immigrants | Dominican Republic | 97.5 /100 | #88 | Exceptional 1.1% |
| Ethiopians | 97.2 /100 | #89 | Exceptional 1.1% |
| Chinese | 97.2 /100 | #90 | Exceptional 1.1% |
| Albanians | 97.2 /100 | #91 | Exceptional 1.1% |
| Immigrants | Cuba | 97.0 /100 | #92 | Exceptional 1.1% |
| Spanish Americans | 96.9 /100 | #93 | Exceptional 1.1% |
| Sri Lankans | 96.8 /100 | #94 | Exceptional 1.1% |
Demographics Similar to Dutch West Indians by Disability Age Under 5
In terms of disability age under 5, the demographic groups most similar to Dutch West Indians are Native/Alaskan (1.9%, a difference of 0.40%), Pennsylvania German (1.9%, a difference of 0.78%), Paraguayan (2.0%, a difference of 2.1%), Chippewa (1.9%, a difference of 2.9%), and French Canadian (1.9%, a difference of 3.0%).
| Demographics | Rating | Rank | Disability Age Under 5 |
| Sioux | 0.0 /100 | #326 | Tragic 1.8% |
| Osage | 0.0 /100 | #327 | Tragic 1.8% |
| Americans | 0.0 /100 | #328 | Tragic 1.9% |
| Houma | 0.0 /100 | #329 | Tragic 1.9% |
| Choctaw | 0.0 /100 | #330 | Tragic 1.9% |
| French Canadians | 0.0 /100 | #331 | Tragic 1.9% |
| Chippewa | 0.0 /100 | #332 | Tragic 1.9% |
| Dutch West Indians | 0.0 /100 | #333 | Tragic 1.9% |
| Natives/Alaskans | 0.0 /100 | #334 | Tragic 1.9% |
| Pennsylvania Germans | 0.0 /100 | #335 | Tragic 1.9% |
| Paraguayans | 0.0 /100 | #336 | Tragic 2.0% |
| Apache | 0.0 /100 | #337 | Tragic 2.0% |
| Tohono O'odham | 0.0 /100 | #338 | Tragic 2.2% |
| Immigrants | Azores | 0.0 /100 | #339 | Tragic 2.2% |
| Menominee | 0.0 /100 | #340 | Tragic 2.3% |