Yakama vs Dutch West Indian Householder Income Ages 45 - 64 years
COMPARE
Yakama
Dutch West Indian
Householder Income Ages 45 - 64 years
Householder Income Ages 45 - 64 years Comparison
Yakama
Dutch West Indians
$86,992
HOUSEHOLDER INCOME AGES 45 - 64 YEARS
0.1/ 100
METRIC RATING
279th/ 347
METRIC RANK
$79,171
HOUSEHOLDER INCOME AGES 45 - 64 YEARS
0.0/ 100
METRIC RATING
329th/ 347
METRIC RANK
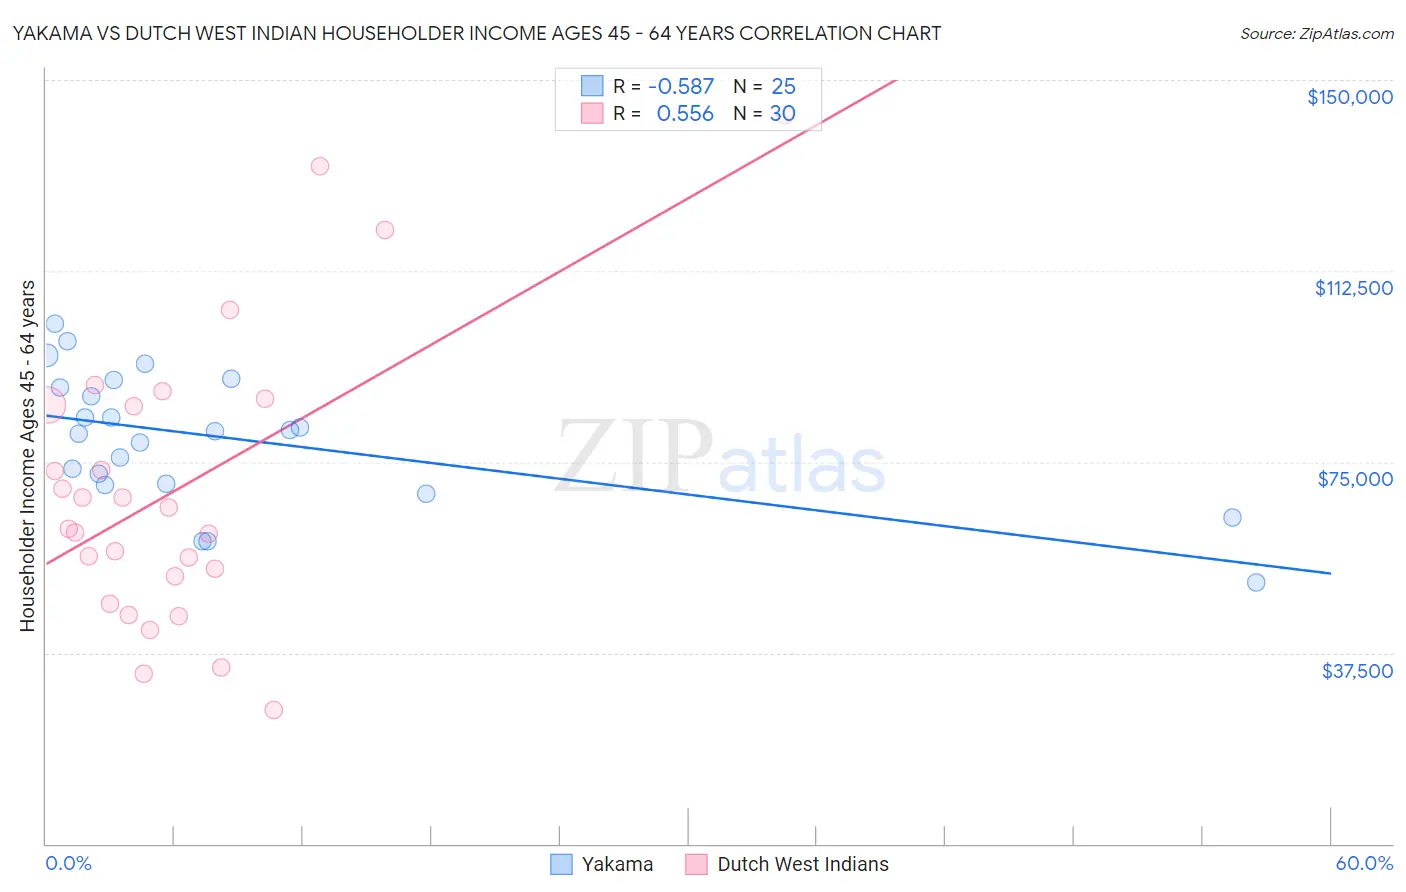
Yakama vs Dutch West Indian Householder Income Ages 45 - 64 years Correlation Chart
The statistical analysis conducted on geographies consisting of 19,897,154 people shows a substantial negative correlation between the proportion of Yakama and household income with householder between the ages 45 and 64 in the United States with a correlation coefficient (R) of -0.587 and weighted average of $86,992. Similarly, the statistical analysis conducted on geographies consisting of 85,713,133 people shows a substantial positive correlation between the proportion of Dutch West Indians and household income with householder between the ages 45 and 64 in the United States with a correlation coefficient (R) of 0.556 and weighted average of $79,171, a difference of 9.9%.
Householder Income Ages 45 - 64 years Correlation Summary
| Measurement | Yakama | Dutch West Indian |
| Minimum | $51,250 | $26,250 |
| Maximum | $102,065 | $143,214 |
| Range | $50,815 | $116,964 |
| Mean | $79,495 | $69,746 |
| Median | $80,929 | $63,988 |
| Interquartile 25% (IQ1) | $70,556 | $52,500 |
| Interquartile 75% (IQ3) | $90,396 | $86,138 |
| Interquartile Range (IQR) | $19,840 | $33,638 |
| Standard Deviation (Sample) | $13,031 | $28,236 |
| Standard Deviation (Population) | $12,768 | $27,762 |
Similar Demographics by Householder Income Ages 45 - 64 years
Demographics Similar to Yakama by Householder Income Ages 45 - 64 years
In terms of householder income ages 45 - 64 years, the demographic groups most similar to Yakama are Immigrants from Somalia ($86,987, a difference of 0.010%), Immigrants from Jamaica ($87,035, a difference of 0.050%), Yaqui ($86,914, a difference of 0.090%), Senegalese ($86,897, a difference of 0.11%), and Mexican ($86,816, a difference of 0.20%).
| Demographics | Rating | Rank | Householder Income Ages 45 - 64 years |
| Cape Verdeans | 0.2 /100 | #272 | Tragic $87,580 |
| Spanish American Indians | 0.2 /100 | #273 | Tragic $87,561 |
| Iroquois | 0.1 /100 | #274 | Tragic $87,255 |
| Immigrants | Belize | 0.1 /100 | #275 | Tragic $87,229 |
| Immigrants | Latin America | 0.1 /100 | #276 | Tragic $87,219 |
| Cree | 0.1 /100 | #277 | Tragic $87,185 |
| Immigrants | Jamaica | 0.1 /100 | #278 | Tragic $87,035 |
| Yakama | 0.1 /100 | #279 | Tragic $86,992 |
| Immigrants | Somalia | 0.1 /100 | #280 | Tragic $86,987 |
| Yaqui | 0.1 /100 | #281 | Tragic $86,914 |
| Senegalese | 0.1 /100 | #282 | Tragic $86,897 |
| Mexicans | 0.1 /100 | #283 | Tragic $86,816 |
| Central American Indians | 0.1 /100 | #284 | Tragic $86,764 |
| Blackfeet | 0.1 /100 | #285 | Tragic $86,595 |
| Immigrants | Guatemala | 0.1 /100 | #286 | Tragic $86,573 |
Demographics Similar to Dutch West Indians by Householder Income Ages 45 - 64 years
In terms of householder income ages 45 - 64 years, the demographic groups most similar to Dutch West Indians are Creek ($78,960, a difference of 0.27%), Immigrants from Dominican Republic ($78,836, a difference of 0.42%), Black/African American ($78,556, a difference of 0.78%), Native/Alaskan ($79,816, a difference of 0.82%), and Seminole ($80,077, a difference of 1.1%).
| Demographics | Rating | Rank | Householder Income Ages 45 - 64 years |
| Sioux | 0.0 /100 | #322 | Tragic $81,750 |
| Bahamians | 0.0 /100 | #323 | Tragic $81,369 |
| Yup'ik | 0.0 /100 | #324 | Tragic $81,000 |
| Immigrants | Cuba | 0.0 /100 | #325 | Tragic $80,662 |
| Dominicans | 0.0 /100 | #326 | Tragic $80,623 |
| Seminole | 0.0 /100 | #327 | Tragic $80,077 |
| Natives/Alaskans | 0.0 /100 | #328 | Tragic $79,816 |
| Dutch West Indians | 0.0 /100 | #329 | Tragic $79,171 |
| Creek | 0.0 /100 | #330 | Tragic $78,960 |
| Immigrants | Dominican Republic | 0.0 /100 | #331 | Tragic $78,836 |
| Blacks/African Americans | 0.0 /100 | #332 | Tragic $78,556 |
| Immigrants | Congo | 0.0 /100 | #333 | Tragic $77,850 |
| Menominee | 0.0 /100 | #334 | Tragic $76,903 |
| Cheyenne | 0.0 /100 | #335 | Tragic $76,362 |
| Arapaho | 0.0 /100 | #336 | Tragic $75,945 |