Yakama vs Black/African American Single Mother Poverty
COMPARE
Yakama
Black/African American
Single Mother Poverty
Single Mother Poverty Comparison
Yakama
Blacks/African Americans
36.4%
SINGLE MOTHER POVERTY
0.0/ 100
METRIC RATING
327th/ 347
METRIC RANK
35.2%
SINGLE MOTHER POVERTY
0.0/ 100
METRIC RATING
322nd/ 347
METRIC RANK
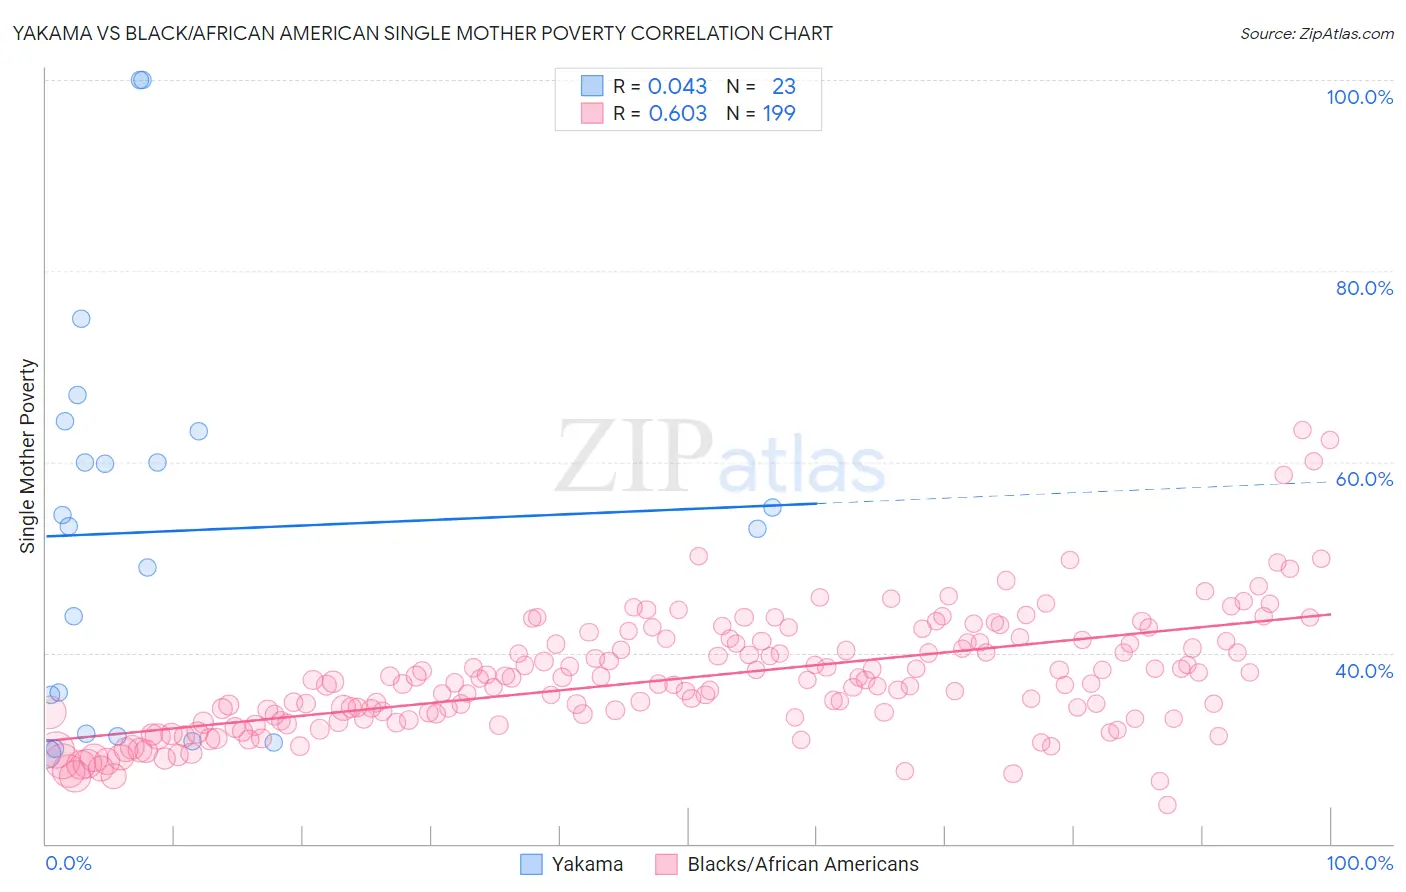
Yakama vs Black/African American Single Mother Poverty Correlation Chart
The statistical analysis conducted on geographies consisting of 19,786,189 people shows no correlation between the proportion of Yakama and poverty level among single mothers in the United States with a correlation coefficient (R) of 0.043 and weighted average of 36.4%. Similarly, the statistical analysis conducted on geographies consisting of 541,579,434 people shows a significant positive correlation between the proportion of Blacks/African Americans and poverty level among single mothers in the United States with a correlation coefficient (R) of 0.603 and weighted average of 35.2%, a difference of 3.4%.
Single Mother Poverty Correlation Summary
| Measurement | Yakama | Black/African American |
| Minimum | 29.5% | 24.1% |
| Maximum | 100.0% | 63.3% |
| Range | 70.5% | 39.2% |
| Mean | 52.7% | 37.4% |
| Median | 53.2% | 36.8% |
| Interquartile 25% (IQ1) | 31.6% | 33.1% |
| Interquartile 75% (IQ3) | 63.2% | 41.1% |
| Interquartile Range (IQR) | 31.6% | 8.0% |
| Standard Deviation (Sample) | 20.4% | 6.3% |
| Standard Deviation (Population) | 20.0% | 6.3% |
Demographics Similar to Yakama and Blacks/African Americans by Single Mother Poverty
In terms of single mother poverty, the demographic groups most similar to Yakama are Choctaw (36.4%, a difference of 0.060%), Apache (36.6%, a difference of 0.53%), Native/Alaskan (36.6%, a difference of 0.64%), Creek (36.7%, a difference of 0.79%), and Dutch West Indian (36.8%, a difference of 1.0%). Similarly, the demographic groups most similar to Blacks/African Americans are Paiute (35.1%, a difference of 0.20%), Kiowa (35.5%, a difference of 0.71%), Ottawa (35.5%, a difference of 0.92%), Iroquois (34.8%, a difference of 1.1%), and Chippewa (34.8%, a difference of 1.3%).
| Demographics | Rating | Rank | Single Mother Poverty |
| Chickasaw | 0.0 /100 | #314 | Tragic 34.4% |
| Hopi | 0.0 /100 | #315 | Tragic 34.5% |
| Dominicans | 0.0 /100 | #316 | Tragic 34.5% |
| Cherokee | 0.0 /100 | #317 | Tragic 34.5% |
| Immigrants | Honduras | 0.0 /100 | #318 | Tragic 34.7% |
| Chippewa | 0.0 /100 | #319 | Tragic 34.8% |
| Iroquois | 0.0 /100 | #320 | Tragic 34.8% |
| Paiute | 0.0 /100 | #321 | Tragic 35.1% |
| Blacks/African Americans | 0.0 /100 | #322 | Tragic 35.2% |
| Kiowa | 0.0 /100 | #323 | Tragic 35.5% |
| Ottawa | 0.0 /100 | #324 | Tragic 35.5% |
| Ute | 0.0 /100 | #325 | Tragic 35.7% |
| Seminole | 0.0 /100 | #326 | Tragic 35.8% |
| Yakama | 0.0 /100 | #327 | Tragic 36.4% |
| Choctaw | 0.0 /100 | #328 | Tragic 36.4% |
| Apache | 0.0 /100 | #329 | Tragic 36.6% |
| Natives/Alaskans | 0.0 /100 | #330 | Tragic 36.6% |
| Creek | 0.0 /100 | #331 | Tragic 36.7% |
| Dutch West Indians | 0.0 /100 | #332 | Tragic 36.8% |
| Menominee | 0.0 /100 | #333 | Tragic 37.1% |
| Pueblo | 0.0 /100 | #334 | Tragic 37.2% |