Mexican American Indian vs Welsh Vision Disability
COMPARE
Mexican American Indian
Welsh
Vision Disability
Vision Disability Comparison
Mexican American Indians
Welsh
2.4%
VISION DISABILITY
0.1/ 100
METRIC RATING
266th/ 347
METRIC RANK
2.3%
VISION DISABILITY
2.3/ 100
METRIC RATING
229th/ 347
METRIC RANK
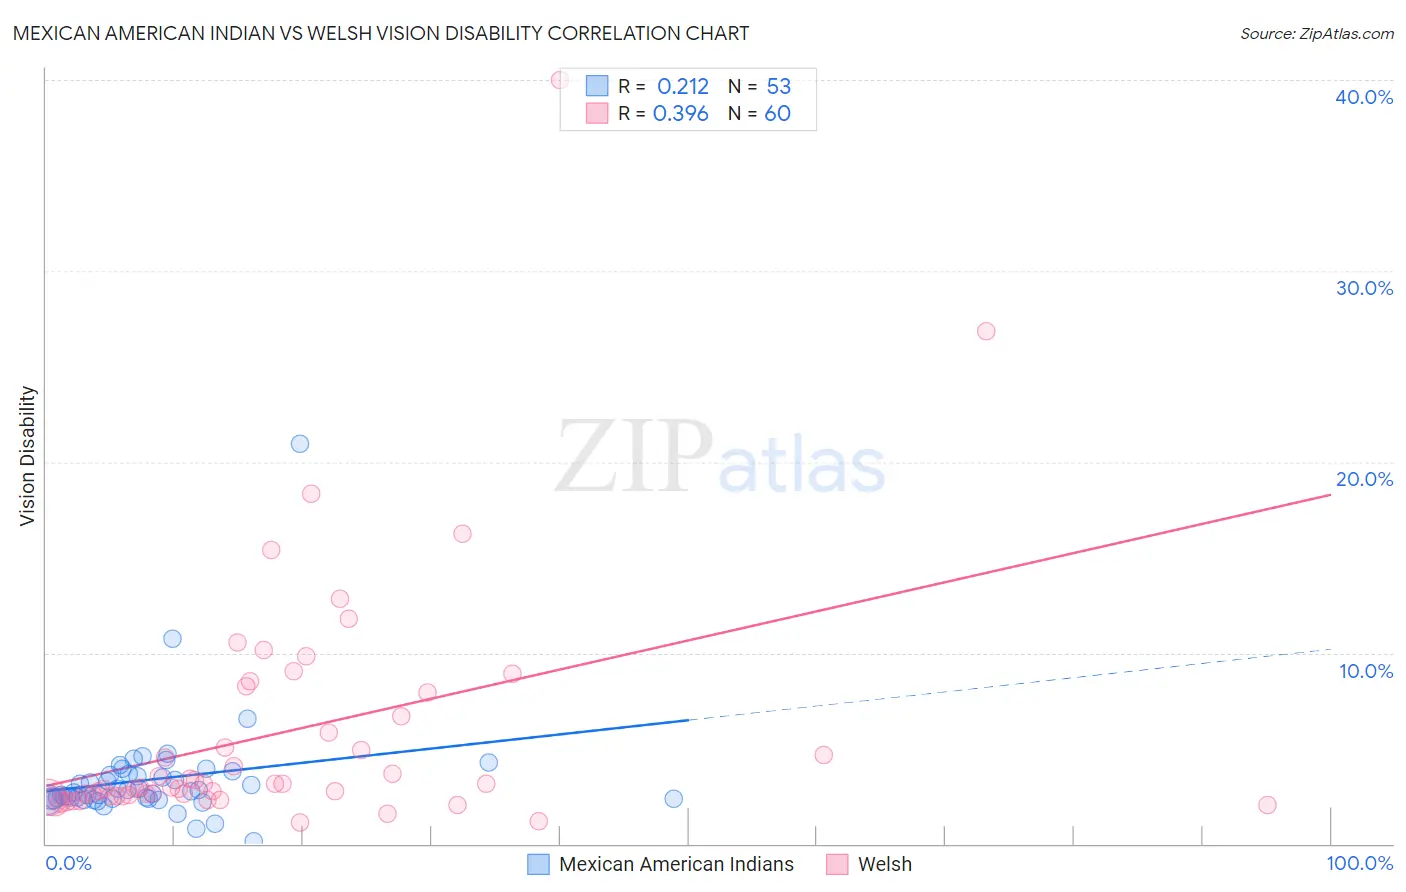
Mexican American Indian vs Welsh Vision Disability Correlation Chart
The statistical analysis conducted on geographies consisting of 317,438,641 people shows a weak positive correlation between the proportion of Mexican American Indians and percentage of population with vision disability in the United States with a correlation coefficient (R) of 0.212 and weighted average of 2.4%. Similarly, the statistical analysis conducted on geographies consisting of 527,426,081 people shows a mild positive correlation between the proportion of Welsh and percentage of population with vision disability in the United States with a correlation coefficient (R) of 0.396 and weighted average of 2.3%, a difference of 4.6%.
Vision Disability Correlation Summary
| Measurement | Mexican American Indian | Welsh |
| Minimum | 0.16% | 1.1% |
| Maximum | 20.9% | 40.0% |
| Range | 20.8% | 38.9% |
| Mean | 3.4% | 5.8% |
| Median | 2.7% | 3.0% |
| Interquartile 25% (IQ1) | 2.4% | 2.5% |
| Interquartile 75% (IQ3) | 3.6% | 7.3% |
| Interquartile Range (IQR) | 1.3% | 4.8% |
| Standard Deviation (Sample) | 2.9% | 6.6% |
| Standard Deviation (Population) | 2.8% | 6.5% |
Similar Demographics by Vision Disability
Demographics Similar to Mexican American Indians by Vision Disability
In terms of vision disability, the demographic groups most similar to Mexican American Indians are Ute (2.4%, a difference of 0.010%), Immigrants from Jamaica (2.4%, a difference of 0.040%), Immigrants from Liberia (2.4%, a difference of 0.070%), Senegalese (2.4%, a difference of 0.10%), and Immigrants from Belize (2.4%, a difference of 0.19%).
| Demographics | Rating | Rank | Vision Disability |
| Whites/Caucasians | 0.2 /100 | #259 | Tragic 2.4% |
| Belizeans | 0.2 /100 | #260 | Tragic 2.4% |
| Fijians | 0.1 /100 | #261 | Tragic 2.4% |
| Jamaicans | 0.1 /100 | #262 | Tragic 2.4% |
| Immigrants | Belize | 0.1 /100 | #263 | Tragic 2.4% |
| Immigrants | Liberia | 0.1 /100 | #264 | Tragic 2.4% |
| Immigrants | Jamaica | 0.1 /100 | #265 | Tragic 2.4% |
| Mexican American Indians | 0.1 /100 | #266 | Tragic 2.4% |
| Ute | 0.1 /100 | #267 | Tragic 2.4% |
| Senegalese | 0.1 /100 | #268 | Tragic 2.4% |
| Celtics | 0.1 /100 | #269 | Tragic 2.4% |
| Cubans | 0.1 /100 | #270 | Tragic 2.4% |
| Immigrants | Azores | 0.1 /100 | #271 | Tragic 2.4% |
| Spaniards | 0.1 /100 | #272 | Tragic 2.4% |
| Immigrants | Bahamas | 0.1 /100 | #273 | Tragic 2.4% |
Demographics Similar to Welsh by Vision Disability
In terms of vision disability, the demographic groups most similar to Welsh are Nicaraguan (2.3%, a difference of 0.070%), Hmong (2.3%, a difference of 0.080%), Immigrants from Ecuador (2.3%, a difference of 0.23%), Hawaiian (2.3%, a difference of 0.32%), and Immigrants from Germany (2.3%, a difference of 0.37%).
| Demographics | Rating | Rank | Vision Disability |
| Immigrants | Senegal | 3.8 /100 | #222 | Tragic 2.3% |
| Basques | 3.5 /100 | #223 | Tragic 2.3% |
| Irish | 3.4 /100 | #224 | Tragic 2.3% |
| Immigrants | Western Africa | 3.4 /100 | #225 | Tragic 2.3% |
| Immigrants | Germany | 3.0 /100 | #226 | Tragic 2.3% |
| Hawaiians | 2.9 /100 | #227 | Tragic 2.3% |
| Hmong | 2.5 /100 | #228 | Tragic 2.3% |
| Welsh | 2.3 /100 | #229 | Tragic 2.3% |
| Nicaraguans | 2.2 /100 | #230 | Tragic 2.3% |
| Immigrants | Ecuador | 2.0 /100 | #231 | Tragic 2.3% |
| German Russians | 1.8 /100 | #232 | Tragic 2.3% |
| Central Americans | 1.8 /100 | #233 | Tragic 2.3% |
| Scottish | 1.6 /100 | #234 | Tragic 2.3% |
| Marshallese | 1.5 /100 | #235 | Tragic 2.3% |
| Immigrants | Congo | 1.4 /100 | #236 | Tragic 2.3% |