Immigrants from Yemen vs American Cognitive Disability
COMPARE
Immigrants from Yemen
American
Cognitive Disability
Cognitive Disability Comparison
Immigrants from Yemen
Americans
18.8%
COGNITIVE DISABILITY
0.0/ 100
METRIC RATING
333rd/ 347
METRIC RANK
17.2%
COGNITIVE DISABILITY
72.2/ 100
METRIC RATING
161st/ 347
METRIC RANK
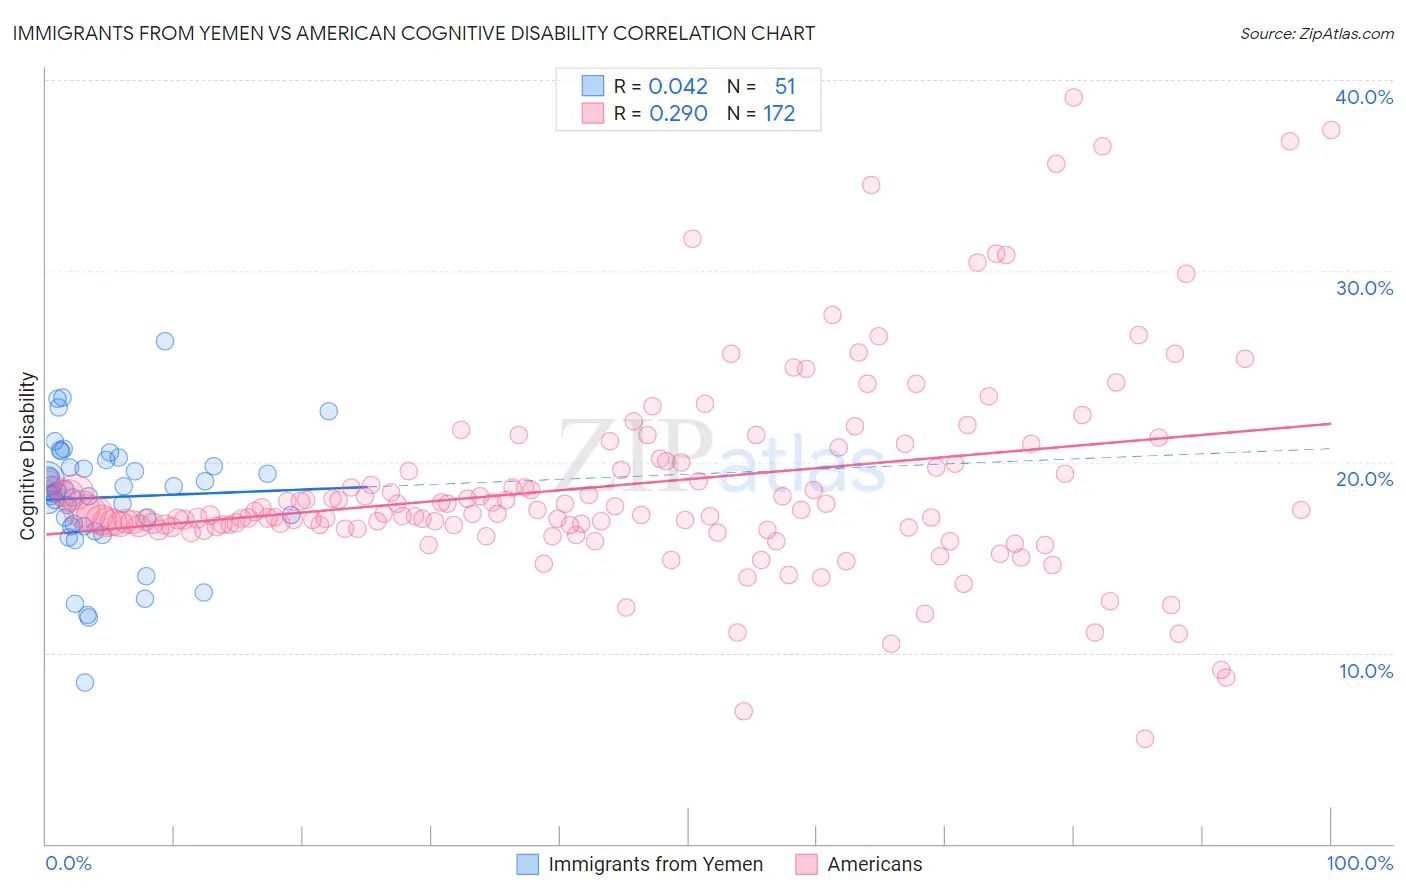
Immigrants from Yemen vs American Cognitive Disability Correlation Chart
The statistical analysis conducted on geographies consisting of 82,433,611 people shows no correlation between the proportion of Immigrants from Yemen and percentage of population with cognitive disability in the United States with a correlation coefficient (R) of 0.042 and weighted average of 18.8%. Similarly, the statistical analysis conducted on geographies consisting of 581,739,029 people shows a weak positive correlation between the proportion of Americans and percentage of population with cognitive disability in the United States with a correlation coefficient (R) of 0.290 and weighted average of 17.2%, a difference of 9.6%.
Cognitive Disability Correlation Summary
| Measurement | Immigrants from Yemen | American |
| Minimum | 8.4% | 5.5% |
| Maximum | 26.3% | 39.1% |
| Range | 17.9% | 33.6% |
| Mean | 18.1% | 18.8% |
| Median | 18.4% | 17.3% |
| Interquartile 25% (IQ1) | 16.6% | 16.6% |
| Interquartile 75% (IQ3) | 19.7% | 19.8% |
| Interquartile Range (IQR) | 3.1% | 3.2% |
| Standard Deviation (Sample) | 3.2% | 5.3% |
| Standard Deviation (Population) | 3.2% | 5.3% |
Similar Demographics by Cognitive Disability
Demographics Similar to Immigrants from Yemen by Cognitive Disability
In terms of cognitive disability, the demographic groups most similar to Immigrants from Yemen are Immigrants from Sudan (18.8%, a difference of 0.060%), Pima (18.8%, a difference of 0.070%), Immigrants from Dominican Republic (18.8%, a difference of 0.14%), Navajo (18.8%, a difference of 0.24%), and Sudanese (18.9%, a difference of 0.38%).
| Demographics | Rating | Rank | Cognitive Disability |
| Immigrants | Senegal | 0.0 /100 | #326 | Tragic 18.7% |
| U.S. Virgin Islanders | 0.0 /100 | #327 | Tragic 18.7% |
| Kiowa | 0.0 /100 | #328 | Tragic 18.7% |
| Navajo | 0.0 /100 | #329 | Tragic 18.8% |
| Immigrants | Dominican Republic | 0.0 /100 | #330 | Tragic 18.8% |
| Pima | 0.0 /100 | #331 | Tragic 18.8% |
| Immigrants | Sudan | 0.0 /100 | #332 | Tragic 18.8% |
| Immigrants | Yemen | 0.0 /100 | #333 | Tragic 18.8% |
| Sudanese | 0.0 /100 | #334 | Tragic 18.9% |
| Senegalese | 0.0 /100 | #335 | Tragic 19.0% |
| Blacks/African Americans | 0.0 /100 | #336 | Tragic 19.0% |
| Immigrants | Saudi Arabia | 0.0 /100 | #337 | Tragic 19.1% |
| Lumbee | 0.0 /100 | #338 | Tragic 19.1% |
| Puerto Ricans | 0.0 /100 | #339 | Tragic 19.2% |
| Cape Verdeans | 0.0 /100 | #340 | Tragic 19.2% |
Demographics Similar to Americans by Cognitive Disability
In terms of cognitive disability, the demographic groups most similar to Americans are Australian (17.2%, a difference of 0.010%), Yugoslavian (17.2%, a difference of 0.020%), Immigrants from Switzerland (17.2%, a difference of 0.020%), Immigrants from Latvia (17.2%, a difference of 0.040%), and Celtic (17.1%, a difference of 0.070%).
| Demographics | Rating | Rank | Cognitive Disability |
| Immigrants | Malaysia | 79.3 /100 | #154 | Good 17.1% |
| Brazilians | 78.9 /100 | #155 | Good 17.1% |
| Sri Lankans | 78.9 /100 | #156 | Good 17.1% |
| Immigrants | Australia | 76.0 /100 | #157 | Good 17.1% |
| Celtics | 74.1 /100 | #158 | Good 17.1% |
| Immigrants | Latvia | 73.2 /100 | #159 | Good 17.2% |
| Australians | 72.4 /100 | #160 | Good 17.2% |
| Americans | 72.2 /100 | #161 | Good 17.2% |
| Yugoslavians | 71.6 /100 | #162 | Good 17.2% |
| Immigrants | Switzerland | 71.5 /100 | #163 | Good 17.2% |
| Armenians | 70.1 /100 | #164 | Good 17.2% |
| Immigrants | Albania | 64.9 /100 | #165 | Good 17.2% |
| Immigrants | Ecuador | 64.4 /100 | #166 | Good 17.2% |
| Immigrants | Syria | 63.5 /100 | #167 | Good 17.2% |
| Immigrants | Immigrants | 62.5 /100 | #168 | Good 17.2% |