Immigrants from Korea vs American Cognitive Disability
COMPARE
Immigrants from Korea
American
Cognitive Disability
Cognitive Disability Comparison
Immigrants from Korea
Americans
16.5%
COGNITIVE DISABILITY
99.8/ 100
METRIC RATING
51st/ 347
METRIC RANK
17.2%
COGNITIVE DISABILITY
72.2/ 100
METRIC RATING
161st/ 347
METRIC RANK
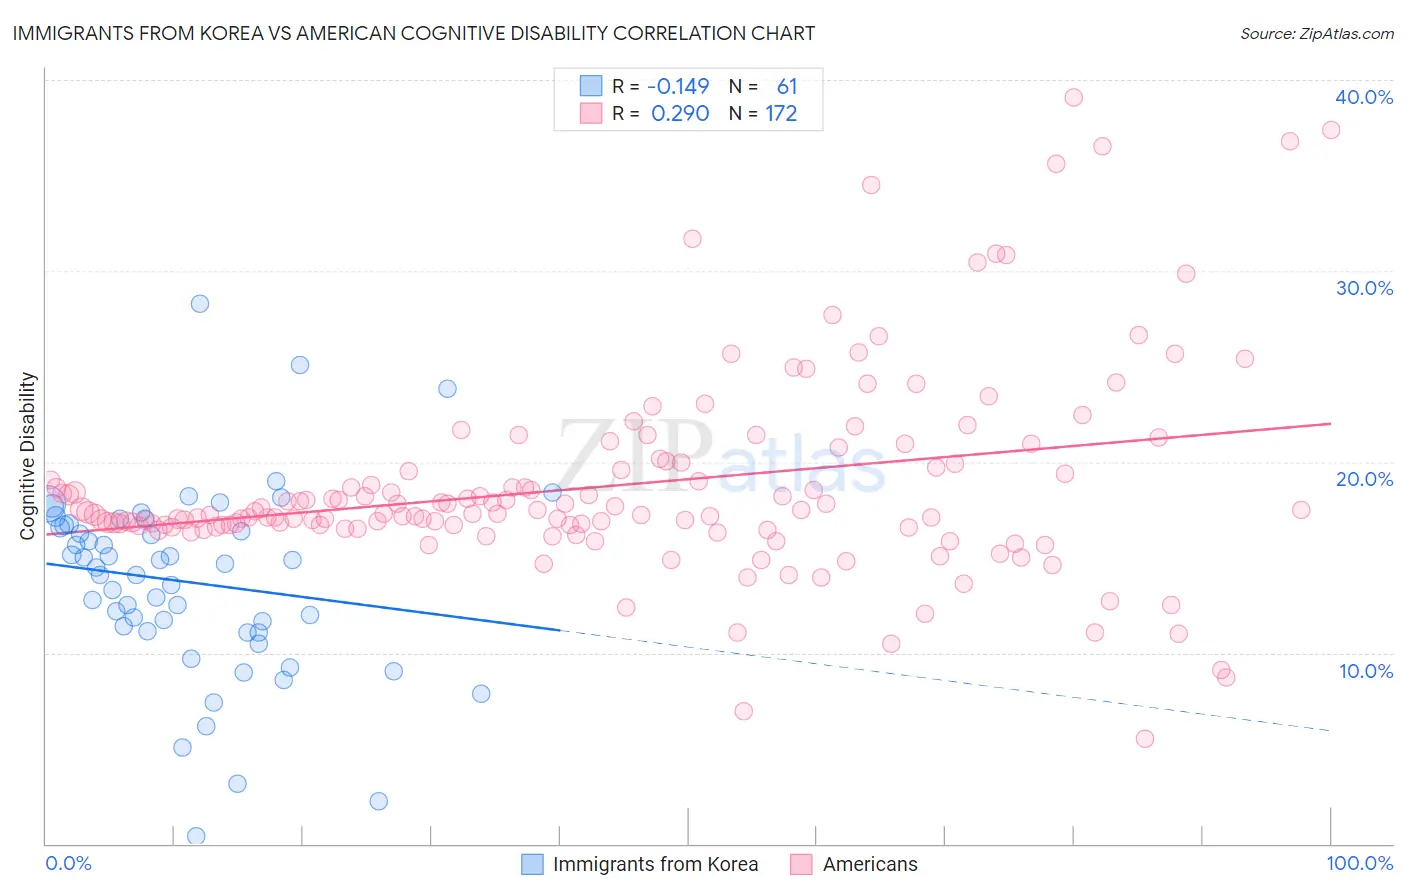
Immigrants from Korea vs American Cognitive Disability Correlation Chart
The statistical analysis conducted on geographies consisting of 416,300,035 people shows a poor negative correlation between the proportion of Immigrants from Korea and percentage of population with cognitive disability in the United States with a correlation coefficient (R) of -0.149 and weighted average of 16.5%. Similarly, the statistical analysis conducted on geographies consisting of 581,739,029 people shows a weak positive correlation between the proportion of Americans and percentage of population with cognitive disability in the United States with a correlation coefficient (R) of 0.290 and weighted average of 17.2%, a difference of 3.9%.
Cognitive Disability Correlation Summary
| Measurement | Immigrants from Korea | American |
| Minimum | 0.40% | 5.5% |
| Maximum | 28.3% | 39.1% |
| Range | 27.9% | 33.6% |
| Mean | 13.7% | 18.8% |
| Median | 14.4% | 17.3% |
| Interquartile 25% (IQ1) | 11.1% | 16.6% |
| Interquartile 75% (IQ3) | 16.7% | 19.8% |
| Interquartile Range (IQR) | 5.6% | 3.2% |
| Standard Deviation (Sample) | 5.0% | 5.3% |
| Standard Deviation (Population) | 4.9% | 5.3% |
Similar Demographics by Cognitive Disability
Demographics Similar to Immigrants from Korea by Cognitive Disability
In terms of cognitive disability, the demographic groups most similar to Immigrants from Korea are Soviet Union (16.5%, a difference of 0.040%), Iranian (16.5%, a difference of 0.050%), Norwegian (16.5%, a difference of 0.050%), Immigrants from Italy (16.5%, a difference of 0.090%), and Immigrants from North America (16.5%, a difference of 0.090%).
| Demographics | Rating | Rank | Cognitive Disability |
| Macedonians | 99.8 /100 | #44 | Exceptional 16.5% |
| Immigrants | Europe | 99.8 /100 | #45 | Exceptional 16.5% |
| Immigrants | Colombia | 99.8 /100 | #46 | Exceptional 16.5% |
| Immigrants | Italy | 99.8 /100 | #47 | Exceptional 16.5% |
| Immigrants | North America | 99.8 /100 | #48 | Exceptional 16.5% |
| Iranians | 99.8 /100 | #49 | Exceptional 16.5% |
| Norwegians | 99.8 /100 | #50 | Exceptional 16.5% |
| Immigrants | Korea | 99.8 /100 | #51 | Exceptional 16.5% |
| Soviet Union | 99.8 /100 | #52 | Exceptional 16.5% |
| Swedes | 99.8 /100 | #53 | Exceptional 16.5% |
| Immigrants | Iran | 99.8 /100 | #54 | Exceptional 16.5% |
| Immigrants | Venezuela | 99.7 /100 | #55 | Exceptional 16.5% |
| Austrians | 99.7 /100 | #56 | Exceptional 16.6% |
| Bhutanese | 99.7 /100 | #57 | Exceptional 16.6% |
| Pennsylvania Germans | 99.7 /100 | #58 | Exceptional 16.6% |
Demographics Similar to Americans by Cognitive Disability
In terms of cognitive disability, the demographic groups most similar to Americans are Australian (17.2%, a difference of 0.010%), Yugoslavian (17.2%, a difference of 0.020%), Immigrants from Switzerland (17.2%, a difference of 0.020%), Immigrants from Latvia (17.2%, a difference of 0.040%), and Celtic (17.1%, a difference of 0.070%).
| Demographics | Rating | Rank | Cognitive Disability |
| Immigrants | Malaysia | 79.3 /100 | #154 | Good 17.1% |
| Brazilians | 78.9 /100 | #155 | Good 17.1% |
| Sri Lankans | 78.9 /100 | #156 | Good 17.1% |
| Immigrants | Australia | 76.0 /100 | #157 | Good 17.1% |
| Celtics | 74.1 /100 | #158 | Good 17.1% |
| Immigrants | Latvia | 73.2 /100 | #159 | Good 17.2% |
| Australians | 72.4 /100 | #160 | Good 17.2% |
| Americans | 72.2 /100 | #161 | Good 17.2% |
| Yugoslavians | 71.6 /100 | #162 | Good 17.2% |
| Immigrants | Switzerland | 71.5 /100 | #163 | Good 17.2% |
| Armenians | 70.1 /100 | #164 | Good 17.2% |
| Immigrants | Albania | 64.9 /100 | #165 | Good 17.2% |
| Immigrants | Ecuador | 64.4 /100 | #166 | Good 17.2% |
| Immigrants | Syria | 63.5 /100 | #167 | Good 17.2% |
| Immigrants | Immigrants | 62.5 /100 | #168 | Good 17.2% |