West Indian vs Immigrants from Zimbabwe Householder Income Over 65 years
COMPARE
West Indian
Immigrants from Zimbabwe
Householder Income Over 65 years
Householder Income Over 65 years Comparison
West Indians
Immigrants from Zimbabwe
$54,936
HOUSEHOLDER INCOME OVER 65 YEARS
0.2/ 100
METRIC RATING
259th/ 347
METRIC RANK
$63,643
HOUSEHOLDER INCOME OVER 65 YEARS
94.3/ 100
METRIC RATING
110th/ 347
METRIC RANK
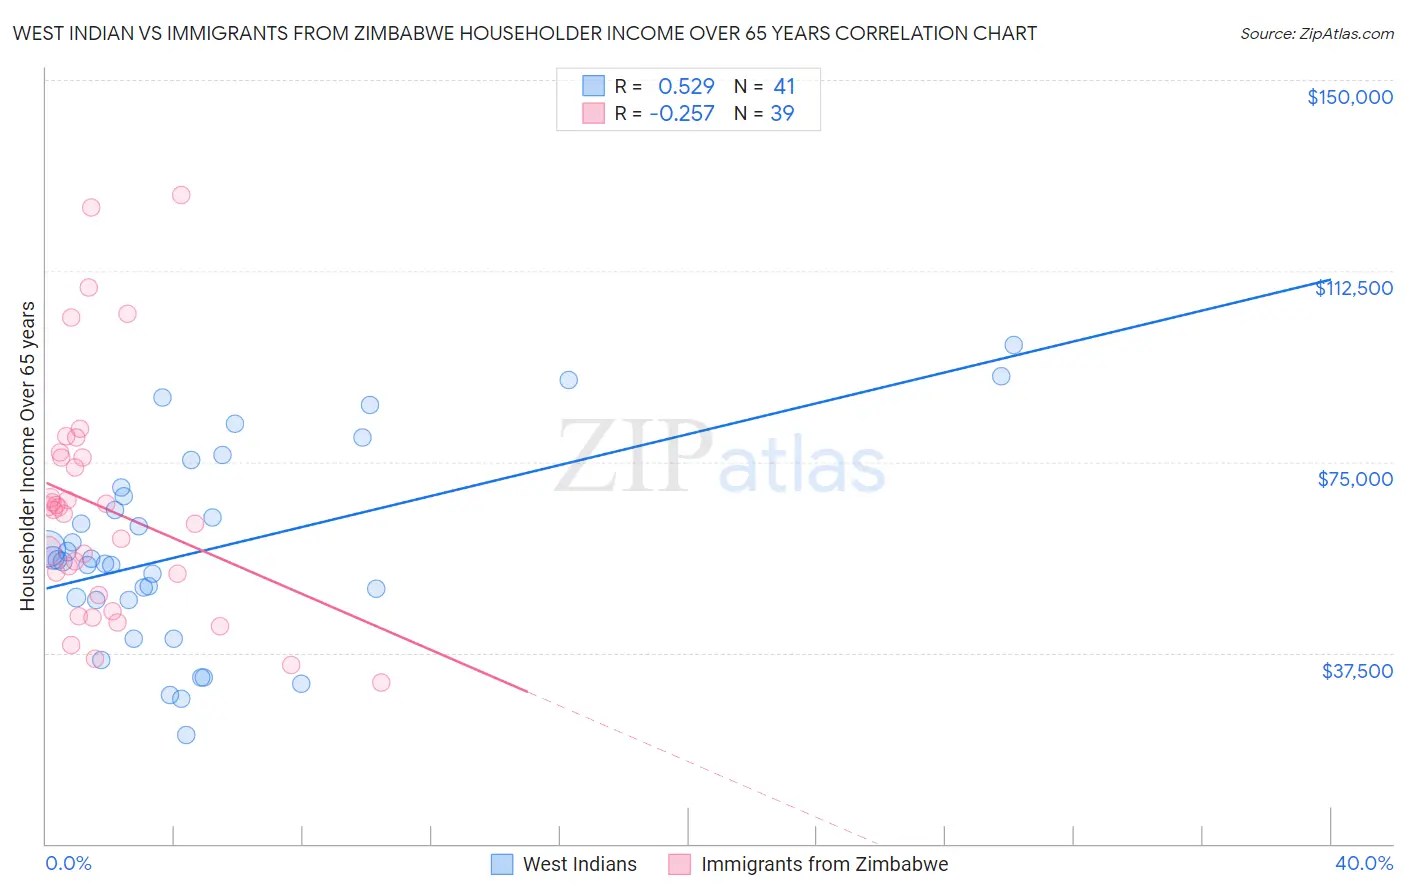
West Indian vs Immigrants from Zimbabwe Householder Income Over 65 years Correlation Chart
The statistical analysis conducted on geographies consisting of 253,324,861 people shows a substantial positive correlation between the proportion of West Indians and household income with householder over the age of 65 in the United States with a correlation coefficient (R) of 0.529 and weighted average of $54,936. Similarly, the statistical analysis conducted on geographies consisting of 117,681,606 people shows a weak negative correlation between the proportion of Immigrants from Zimbabwe and household income with householder over the age of 65 in the United States with a correlation coefficient (R) of -0.257 and weighted average of $63,643, a difference of 15.9%.
Householder Income Over 65 years Correlation Summary
| Measurement | West Indian | Immigrants from Zimbabwe |
| Minimum | $21,368 | $31,667 |
| Maximum | $97,868 | $127,419 |
| Range | $76,500 | $95,752 |
| Mean | $57,688 | $66,069 |
| Median | $55,650 | $65,586 |
| Interquartile 25% (IQ1) | $47,931 | $48,854 |
| Interquartile 75% (IQ3) | $69,062 | $75,873 |
| Interquartile Range (IQR) | $21,132 | $27,019 |
| Standard Deviation (Sample) | $18,888 | $23,035 |
| Standard Deviation (Population) | $18,656 | $22,738 |
Similar Demographics by Householder Income Over 65 years
Demographics Similar to West Indians by Householder Income Over 65 years
In terms of householder income over 65 years, the demographic groups most similar to West Indians are Immigrants from West Indies ($54,927, a difference of 0.020%), Comanche ($54,922, a difference of 0.030%), Ecuadorian ($54,958, a difference of 0.040%), Bangladeshi ($54,719, a difference of 0.40%), and French American Indian ($54,699, a difference of 0.43%).
| Demographics | Rating | Rank | Householder Income Over 65 years |
| Osage | 0.4 /100 | #252 | Tragic $55,677 |
| Immigrants | Trinidad and Tobago | 0.4 /100 | #253 | Tragic $55,598 |
| Americans | 0.3 /100 | #254 | Tragic $55,527 |
| Immigrants | Bangladesh | 0.3 /100 | #255 | Tragic $55,394 |
| German Russians | 0.3 /100 | #256 | Tragic $55,356 |
| Trinidadians and Tobagonians | 0.3 /100 | #257 | Tragic $55,327 |
| Ecuadorians | 0.2 /100 | #258 | Tragic $54,958 |
| West Indians | 0.2 /100 | #259 | Tragic $54,936 |
| Immigrants | West Indies | 0.2 /100 | #260 | Tragic $54,927 |
| Comanche | 0.2 /100 | #261 | Tragic $54,922 |
| Bangladeshis | 0.1 /100 | #262 | Tragic $54,719 |
| French American Indians | 0.1 /100 | #263 | Tragic $54,699 |
| Apache | 0.1 /100 | #264 | Tragic $54,668 |
| Belizeans | 0.1 /100 | #265 | Tragic $54,580 |
| Jamaicans | 0.1 /100 | #266 | Tragic $54,560 |
Demographics Similar to Immigrants from Zimbabwe by Householder Income Over 65 years
In terms of householder income over 65 years, the demographic groups most similar to Immigrants from Zimbabwe are Immigrants from Spain ($63,540, a difference of 0.16%), European ($63,779, a difference of 0.21%), Syrian ($63,494, a difference of 0.24%), Palestinian ($63,800, a difference of 0.25%), and Pakistani ($63,844, a difference of 0.32%).
| Demographics | Rating | Rank | Householder Income Over 65 years |
| British | 95.7 /100 | #103 | Exceptional $63,940 |
| Immigrants | Cameroon | 95.6 /100 | #104 | Exceptional $63,907 |
| Italians | 95.5 /100 | #105 | Exceptional $63,885 |
| Immigrants | Argentina | 95.5 /100 | #106 | Exceptional $63,885 |
| Pakistanis | 95.3 /100 | #107 | Exceptional $63,844 |
| Palestinians | 95.1 /100 | #108 | Exceptional $63,800 |
| Europeans | 95.0 /100 | #109 | Exceptional $63,779 |
| Immigrants | Zimbabwe | 94.3 /100 | #110 | Exceptional $63,643 |
| Immigrants | Spain | 93.7 /100 | #111 | Exceptional $63,540 |
| Syrians | 93.4 /100 | #112 | Exceptional $63,494 |
| Immigrants | Serbia | 92.7 /100 | #113 | Exceptional $63,387 |
| Immigrants | Saudi Arabia | 92.4 /100 | #114 | Exceptional $63,355 |
| Croatians | 91.4 /100 | #115 | Exceptional $63,225 |
| Guamanians/Chamorros | 91.1 /100 | #116 | Exceptional $63,187 |
| Immigrants | Croatia | 90.9 /100 | #117 | Exceptional $63,168 |