West Indian vs Immigrants from Zimbabwe College, 1 year or more
COMPARE
West Indian
Immigrants from Zimbabwe
College, 1 year or more
College, 1 year or more Comparison
West Indians
Immigrants from Zimbabwe
56.3%
COLLEGE, 1 YEAR OR MORE
1.8/ 100
METRIC RATING
235th/ 347
METRIC RANK
63.3%
COLLEGE, 1 YEAR OR MORE
99.3/ 100
METRIC RATING
69th/ 347
METRIC RANK
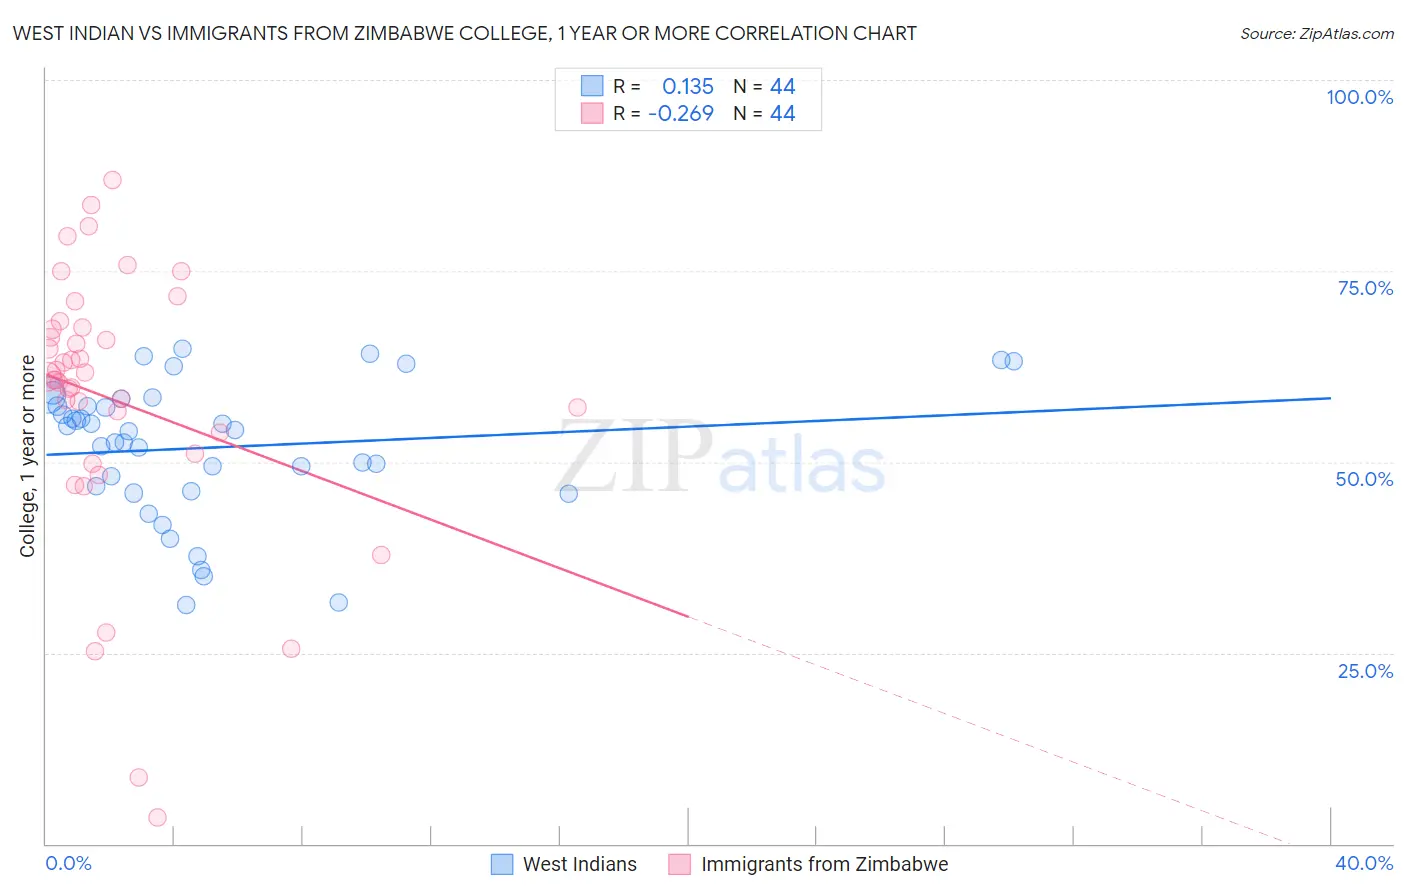
West Indian vs Immigrants from Zimbabwe College, 1 year or more Correlation Chart
The statistical analysis conducted on geographies consisting of 254,063,654 people shows a poor positive correlation between the proportion of West Indians and percentage of population with at least college, 1 year or more education in the United States with a correlation coefficient (R) of 0.135 and weighted average of 56.3%. Similarly, the statistical analysis conducted on geographies consisting of 117,809,864 people shows a weak negative correlation between the proportion of Immigrants from Zimbabwe and percentage of population with at least college, 1 year or more education in the United States with a correlation coefficient (R) of -0.269 and weighted average of 63.3%, a difference of 12.5%.
College, 1 year or more Correlation Summary
| Measurement | West Indian | Immigrants from Zimbabwe |
| Minimum | 31.2% | 3.5% |
| Maximum | 64.8% | 87.0% |
| Range | 33.6% | 83.5% |
| Mean | 51.9% | 58.0% |
| Median | 54.1% | 60.9% |
| Interquartile 25% (IQ1) | 46.5% | 52.5% |
| Interquartile 75% (IQ3) | 57.8% | 67.5% |
| Interquartile Range (IQR) | 11.3% | 15.0% |
| Standard Deviation (Sample) | 8.9% | 17.9% |
| Standard Deviation (Population) | 8.8% | 17.7% |
Similar Demographics by College, 1 year or more
Demographics Similar to West Indians by College, 1 year or more
In terms of college, 1 year or more, the demographic groups most similar to West Indians are Spanish American (56.3%, a difference of 0.0%), Iroquois (56.2%, a difference of 0.050%), Samoan (56.2%, a difference of 0.16%), Barbadian (56.0%, a difference of 0.43%), and Nonimmigrants (56.5%, a difference of 0.45%).
| Demographics | Rating | Rank | College, 1 year or more |
| Immigrants | Fiji | 4.0 /100 | #228 | Tragic 56.9% |
| Cree | 3.6 /100 | #229 | Tragic 56.8% |
| Liberians | 3.1 /100 | #230 | Tragic 56.7% |
| Immigrants | Burma/Myanmar | 2.7 /100 | #231 | Tragic 56.6% |
| Immigrants | Bangladesh | 2.6 /100 | #232 | Tragic 56.6% |
| Immigrants | Nonimmigrants | 2.5 /100 | #233 | Tragic 56.5% |
| Spanish Americans | 1.8 /100 | #234 | Tragic 56.3% |
| West Indians | 1.8 /100 | #235 | Tragic 56.3% |
| Iroquois | 1.7 /100 | #236 | Tragic 56.2% |
| Samoans | 1.6 /100 | #237 | Tragic 56.2% |
| Barbadians | 1.3 /100 | #238 | Tragic 56.0% |
| Puget Sound Salish | 1.1 /100 | #239 | Tragic 55.9% |
| Trinidadians and Tobagonians | 1.1 /100 | #240 | Tragic 55.8% |
| French American Indians | 1.0 /100 | #241 | Tragic 55.8% |
| Marshallese | 1.0 /100 | #242 | Tragic 55.8% |
Demographics Similar to Immigrants from Zimbabwe by College, 1 year or more
In terms of college, 1 year or more, the demographic groups most similar to Immigrants from Zimbabwe are Immigrants from Greece (63.3%, a difference of 0.0%), Immigrants from Romania (63.3%, a difference of 0.020%), Immigrants from Europe (63.3%, a difference of 0.040%), Argentinean (63.2%, a difference of 0.10%), and Maltese (63.4%, a difference of 0.14%).
| Demographics | Rating | Rank | College, 1 year or more |
| Immigrants | Indonesia | 99.5 /100 | #62 | Exceptional 63.5% |
| Immigrants | Scotland | 99.4 /100 | #63 | Exceptional 63.4% |
| Immigrants | Spain | 99.4 /100 | #64 | Exceptional 63.4% |
| Maltese | 99.3 /100 | #65 | Exceptional 63.4% |
| Immigrants | Europe | 99.3 /100 | #66 | Exceptional 63.3% |
| Immigrants | Romania | 99.3 /100 | #67 | Exceptional 63.3% |
| Immigrants | Greece | 99.3 /100 | #68 | Exceptional 63.3% |
| Immigrants | Zimbabwe | 99.3 /100 | #69 | Exceptional 63.3% |
| Argentineans | 99.2 /100 | #70 | Exceptional 63.2% |
| Immigrants | Canada | 99.1 /100 | #71 | Exceptional 63.1% |
| Egyptians | 99.0 /100 | #72 | Exceptional 63.1% |
| Immigrants | Moldova | 99.0 /100 | #73 | Exceptional 63.0% |
| Immigrants | North America | 99.0 /100 | #74 | Exceptional 63.0% |
| Armenians | 98.9 /100 | #75 | Exceptional 63.0% |
| Paraguayans | 98.8 /100 | #76 | Exceptional 62.9% |