Welsh vs Immigrants from Ukraine 10th Grade
COMPARE
Welsh
Immigrants from Ukraine
10th Grade
10th Grade Comparison
Welsh
Immigrants from Ukraine
95.5%
10TH GRADE
100.0/ 100
METRIC RATING
26th/ 347
METRIC RANK
94.0%
10TH GRADE
81.5/ 100
METRIC RATING
147th/ 347
METRIC RANK
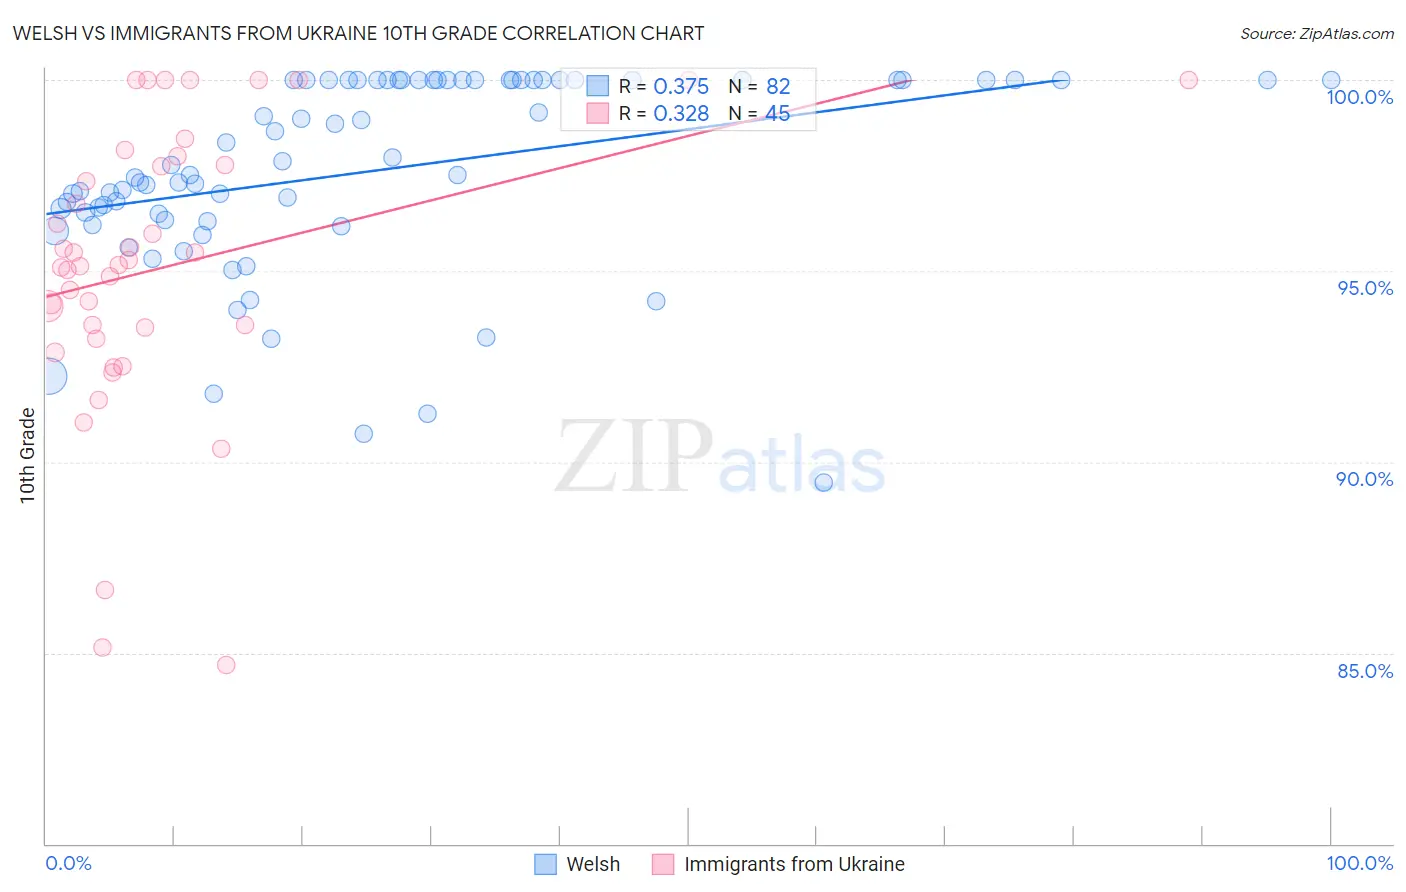
Welsh vs Immigrants from Ukraine 10th Grade Correlation Chart
The statistical analysis conducted on geographies consisting of 528,594,177 people shows a mild positive correlation between the proportion of Welsh and percentage of population with at least 10th grade education in the United States with a correlation coefficient (R) of 0.375 and weighted average of 95.5%. Similarly, the statistical analysis conducted on geographies consisting of 289,714,613 people shows a mild positive correlation between the proportion of Immigrants from Ukraine and percentage of population with at least 10th grade education in the United States with a correlation coefficient (R) of 0.328 and weighted average of 94.0%, a difference of 1.5%.
10th Grade Correlation Summary
| Measurement | Welsh | Immigrants from Ukraine |
| Minimum | 89.5% | 84.7% |
| Maximum | 100.0% | 100.0% |
| Range | 10.5% | 15.3% |
| Mean | 97.6% | 95.1% |
| Median | 97.6% | 95.2% |
| Interquartile 25% (IQ1) | 96.3% | 93.4% |
| Interquartile 75% (IQ3) | 100.0% | 97.9% |
| Interquartile Range (IQR) | 3.7% | 4.5% |
| Standard Deviation (Sample) | 2.6% | 3.7% |
| Standard Deviation (Population) | 2.5% | 3.7% |
Similar Demographics by 10th Grade
Demographics Similar to Welsh by 10th Grade
In terms of 10th grade, the demographic groups most similar to Welsh are European (95.5%, a difference of 0.020%), Maltese (95.5%, a difference of 0.020%), Alaskan Athabascan (95.4%, a difference of 0.020%), Luxembourger (95.4%, a difference of 0.020%), and Czech (95.5%, a difference of 0.030%).
| Demographics | Rating | Rank | 10th Grade |
| Scandinavians | 100.0 /100 | #19 | Exceptional 95.6% |
| Chinese | 100.0 /100 | #20 | Exceptional 95.5% |
| Dutch | 100.0 /100 | #21 | Exceptional 95.5% |
| Eastern Europeans | 100.0 /100 | #22 | Exceptional 95.5% |
| Czechs | 100.0 /100 | #23 | Exceptional 95.5% |
| Europeans | 100.0 /100 | #24 | Exceptional 95.5% |
| Maltese | 100.0 /100 | #25 | Exceptional 95.5% |
| Welsh | 100.0 /100 | #26 | Exceptional 95.5% |
| Alaskan Athabascans | 100.0 /100 | #27 | Exceptional 95.4% |
| Luxembourgers | 100.0 /100 | #28 | Exceptional 95.4% |
| Bulgarians | 100.0 /100 | #29 | Exceptional 95.4% |
| Belgians | 100.0 /100 | #30 | Exceptional 95.4% |
| Iranians | 100.0 /100 | #31 | Exceptional 95.3% |
| Hungarians | 100.0 /100 | #32 | Exceptional 95.3% |
| French | 100.0 /100 | #33 | Exceptional 95.3% |
Demographics Similar to Immigrants from Ukraine by 10th Grade
In terms of 10th grade, the demographic groups most similar to Immigrants from Ukraine are Arab (94.0%, a difference of 0.010%), Ugandan (94.0%, a difference of 0.010%), Chickasaw (94.1%, a difference of 0.020%), Egyptian (94.0%, a difference of 0.030%), and Kenyan (94.0%, a difference of 0.030%).
| Demographics | Rating | Rank | 10th Grade |
| Immigrants | Jordan | 87.6 /100 | #140 | Excellent 94.1% |
| Hmong | 86.6 /100 | #141 | Excellent 94.1% |
| Albanians | 86.5 /100 | #142 | Excellent 94.1% |
| Cherokee | 84.9 /100 | #143 | Excellent 94.1% |
| Immigrants | Kazakhstan | 84.9 /100 | #144 | Excellent 94.1% |
| Immigrants | Nonimmigrants | 83.8 /100 | #145 | Excellent 94.1% |
| Chickasaw | 82.6 /100 | #146 | Excellent 94.1% |
| Immigrants | Ukraine | 81.5 /100 | #147 | Excellent 94.0% |
| Arabs | 80.9 /100 | #148 | Excellent 94.0% |
| Ugandans | 80.7 /100 | #149 | Excellent 94.0% |
| Egyptians | 79.6 /100 | #150 | Good 94.0% |
| Kenyans | 79.1 /100 | #151 | Good 94.0% |
| Immigrants | Italy | 78.0 /100 | #152 | Good 94.0% |
| Immigrants | Brazil | 75.5 /100 | #153 | Good 94.0% |
| Immigrants | Kenya | 75.3 /100 | #154 | Good 94.0% |