Welsh vs Estonian 9th Grade
COMPARE
Welsh
Estonian
9th Grade
9th Grade Comparison
Welsh
Estonians
96.4%
9TH GRADE
100.0/ 100
METRIC RATING
19th/ 347
METRIC RANK
96.1%
9TH GRADE
99.9/ 100
METRIC RATING
37th/ 347
METRIC RANK
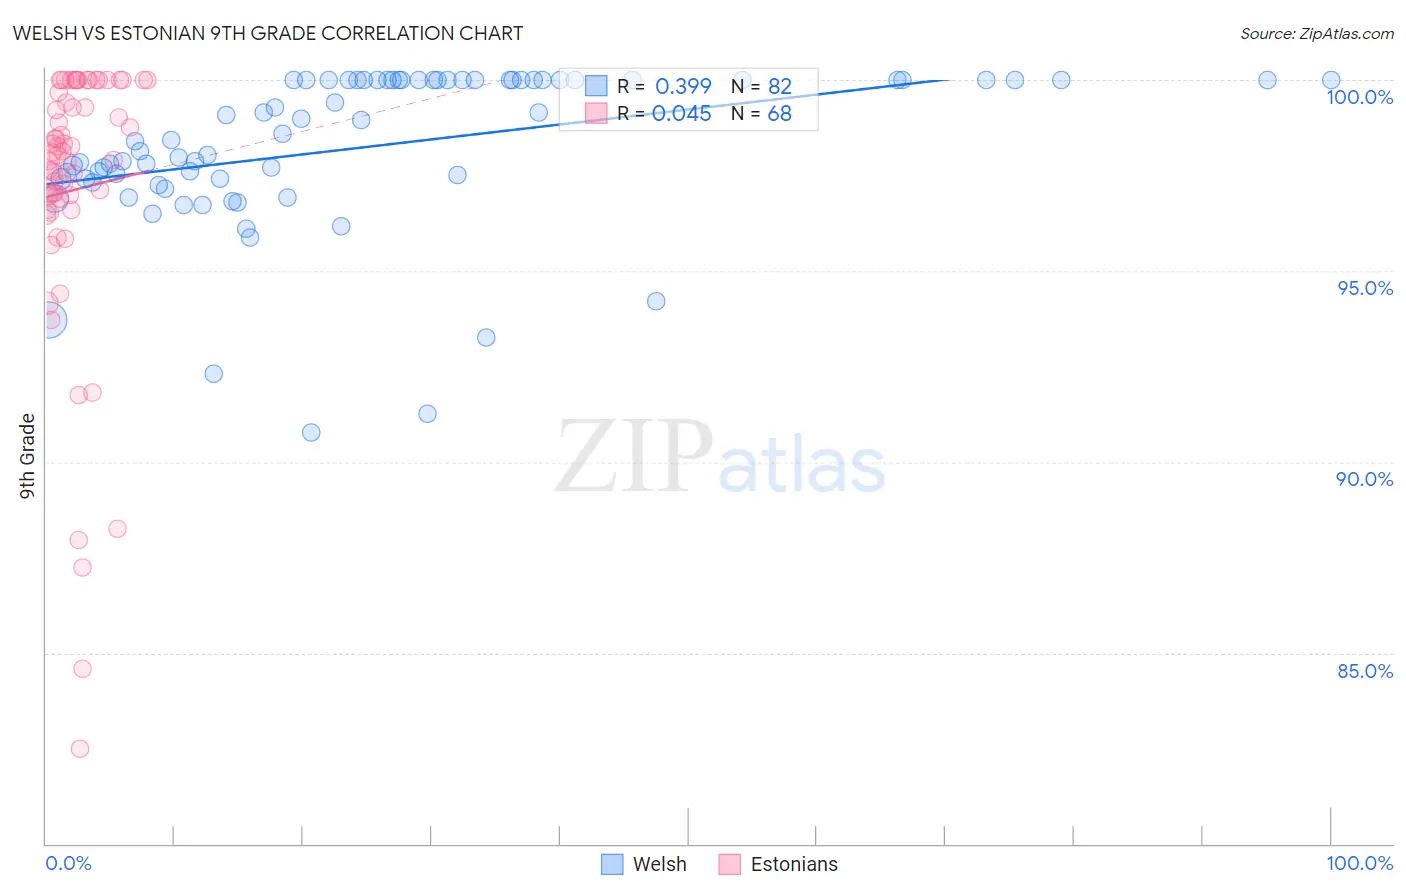
Welsh vs Estonian 9th Grade Correlation Chart
The statistical analysis conducted on geographies consisting of 528,596,253 people shows a mild positive correlation between the proportion of Welsh and percentage of population with at least 9th grade education in the United States with a correlation coefficient (R) of 0.399 and weighted average of 96.4%. Similarly, the statistical analysis conducted on geographies consisting of 123,528,404 people shows no correlation between the proportion of Estonians and percentage of population with at least 9th grade education in the United States with a correlation coefficient (R) of 0.045 and weighted average of 96.1%, a difference of 0.28%.
9th Grade Correlation Summary
| Measurement | Welsh | Estonian |
| Minimum | 90.8% | 82.5% |
| Maximum | 100.0% | 100.0% |
| Range | 9.2% | 17.5% |
| Mean | 98.2% | 97.1% |
| Median | 98.5% | 98.1% |
| Interquartile 25% (IQ1) | 97.4% | 96.7% |
| Interquartile 75% (IQ3) | 100.0% | 99.8% |
| Interquartile Range (IQR) | 2.6% | 3.1% |
| Standard Deviation (Sample) | 2.1% | 3.7% |
| Standard Deviation (Population) | 2.1% | 3.7% |
Demographics Similar to Welsh and Estonians by 9th Grade
In terms of 9th grade, the demographic groups most similar to Welsh are Italian (96.4%, a difference of 0.0%), Alaskan Athabascan (96.4%, a difference of 0.020%), European (96.4%, a difference of 0.030%), Scandinavian (96.5%, a difference of 0.040%), and Czech (96.4%, a difference of 0.040%). Similarly, the demographic groups most similar to Estonians are Immigrants from Scotland (96.1%, a difference of 0.0%), Northern European (96.2%, a difference of 0.040%), Bulgarian (96.2%, a difference of 0.050%), Hungarian (96.2%, a difference of 0.090%), and Luxembourger (96.3%, a difference of 0.12%).
| Demographics | Rating | Rank | 9th Grade |
| Scandinavians | 100.0 /100 | #18 | Exceptional 96.5% |
| Welsh | 100.0 /100 | #19 | Exceptional 96.4% |
| Italians | 100.0 /100 | #20 | Exceptional 96.4% |
| Alaskan Athabascans | 100.0 /100 | #21 | Exceptional 96.4% |
| Europeans | 100.0 /100 | #22 | Exceptional 96.4% |
| Czechs | 100.0 /100 | #23 | Exceptional 96.4% |
| Latvians | 100.0 /100 | #24 | Exceptional 96.4% |
| French | 100.0 /100 | #25 | Exceptional 96.3% |
| French Canadians | 100.0 /100 | #26 | Exceptional 96.3% |
| Scotch-Irish | 100.0 /100 | #27 | Exceptional 96.3% |
| Eastern Europeans | 100.0 /100 | #28 | Exceptional 96.3% |
| Chinese | 100.0 /100 | #29 | Exceptional 96.3% |
| Maltese | 100.0 /100 | #30 | Exceptional 96.3% |
| British | 100.0 /100 | #31 | Exceptional 96.3% |
| Belgians | 100.0 /100 | #32 | Exceptional 96.3% |
| Luxembourgers | 100.0 /100 | #33 | Exceptional 96.3% |
| Hungarians | 100.0 /100 | #34 | Exceptional 96.2% |
| Bulgarians | 99.9 /100 | #35 | Exceptional 96.2% |
| Northern Europeans | 99.9 /100 | #36 | Exceptional 96.2% |
| Estonians | 99.9 /100 | #37 | Exceptional 96.1% |
| Immigrants | Scotland | 99.9 /100 | #38 | Exceptional 96.1% |