Vietnamese vs Immigrants from Haiti Hearing Disability
COMPARE
Vietnamese
Immigrants from Haiti
Hearing Disability
Hearing Disability Comparison
Vietnamese
Immigrants from Haiti
2.4%
HEARING DISABILITY
100.0/ 100
METRIC RATING
6th/ 347
METRIC RANK
2.6%
HEARING DISABILITY
99.7/ 100
METRIC RATING
28th/ 347
METRIC RANK
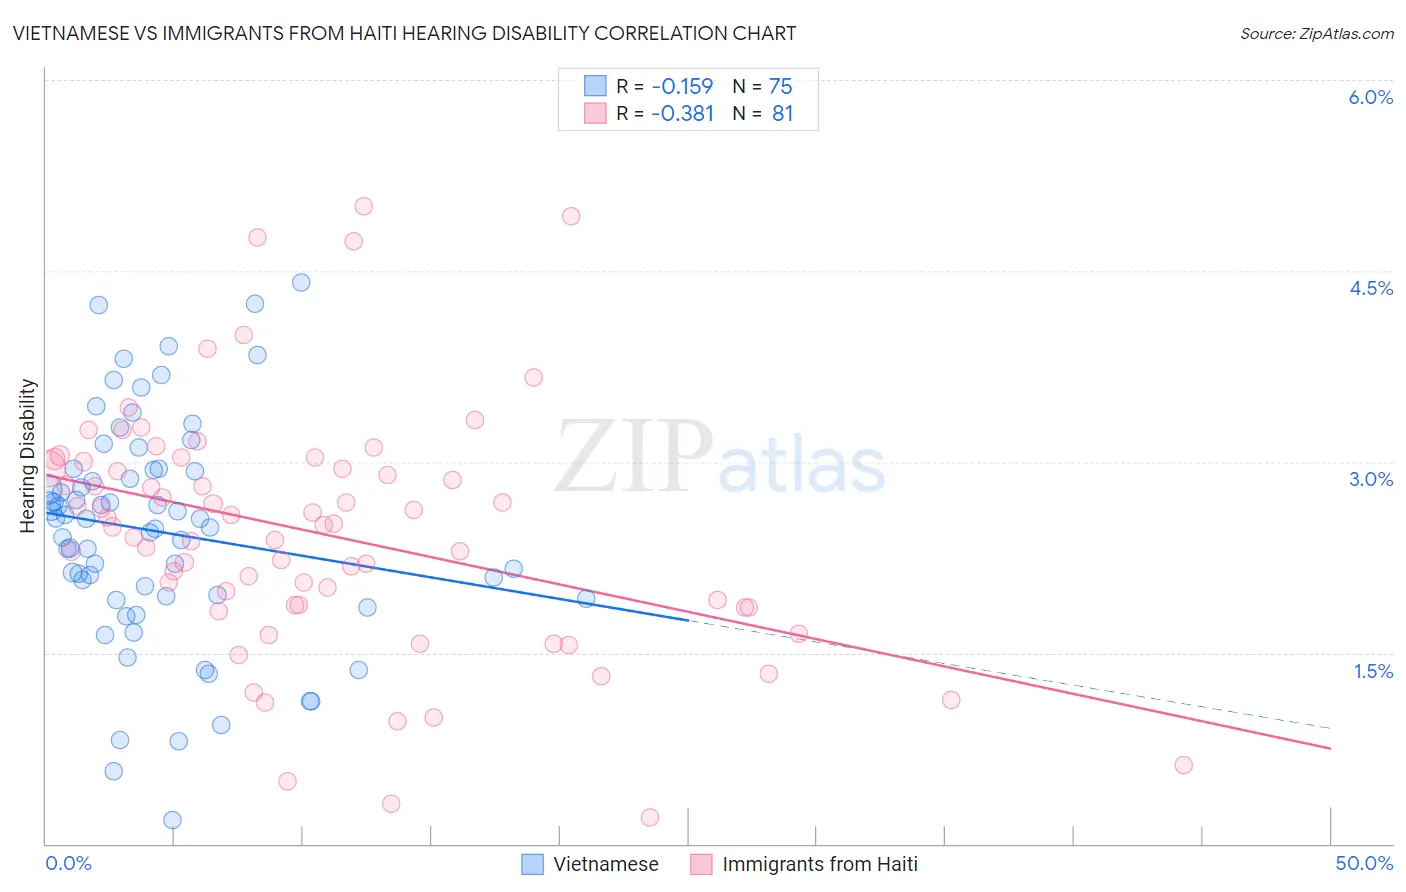
Vietnamese vs Immigrants from Haiti Hearing Disability Correlation Chart
The statistical analysis conducted on geographies consisting of 170,714,585 people shows a poor negative correlation between the proportion of Vietnamese and percentage of population with hearing disability in the United States with a correlation coefficient (R) of -0.159 and weighted average of 2.4%. Similarly, the statistical analysis conducted on geographies consisting of 225,193,212 people shows a mild negative correlation between the proportion of Immigrants from Haiti and percentage of population with hearing disability in the United States with a correlation coefficient (R) of -0.381 and weighted average of 2.6%, a difference of 8.5%.
Hearing Disability Correlation Summary
| Measurement | Vietnamese | Immigrants from Haiti |
| Minimum | 0.18% | 0.20% |
| Maximum | 4.4% | 5.0% |
| Range | 4.2% | 4.8% |
| Mean | 2.5% | 2.4% |
| Median | 2.6% | 2.5% |
| Interquartile 25% (IQ1) | 1.9% | 1.9% |
| Interquartile 75% (IQ3) | 2.9% | 3.0% |
| Interquartile Range (IQR) | 0.99% | 1.1% |
| Standard Deviation (Sample) | 0.87% | 0.97% |
| Standard Deviation (Population) | 0.87% | 0.96% |
Similar Demographics by Hearing Disability
Demographics Similar to Vietnamese by Hearing Disability
In terms of hearing disability, the demographic groups most similar to Vietnamese are Immigrants from Barbados (2.4%, a difference of 1.1%), Immigrants from Bangladesh (2.4%, a difference of 1.6%), British West Indian (2.4%, a difference of 1.8%), Immigrants from Dominican Republic (2.4%, a difference of 2.6%), and Immigrants from Guyana (2.3%, a difference of 3.0%).
| Demographics | Rating | Rank | Hearing Disability |
| Immigrants | Grenada | 100.0 /100 | #1 | Exceptional 2.2% |
| Immigrants | St. Vincent and the Grenadines | 100.0 /100 | #2 | Exceptional 2.3% |
| Guyanese | 100.0 /100 | #3 | Exceptional 2.3% |
| Immigrants | Guyana | 100.0 /100 | #4 | Exceptional 2.3% |
| Immigrants | Barbados | 100.0 /100 | #5 | Exceptional 2.4% |
| Vietnamese | 100.0 /100 | #6 | Exceptional 2.4% |
| Immigrants | Bangladesh | 100.0 /100 | #7 | Exceptional 2.4% |
| British West Indians | 100.0 /100 | #8 | Exceptional 2.4% |
| Immigrants | Dominican Republic | 100.0 /100 | #9 | Exceptional 2.4% |
| Immigrants | Ecuador | 99.9 /100 | #10 | Exceptional 2.5% |
| Immigrants | Trinidad and Tobago | 99.9 /100 | #11 | Exceptional 2.5% |
| Trinidadians and Tobagonians | 99.9 /100 | #12 | Exceptional 2.5% |
| Sierra Leoneans | 99.9 /100 | #13 | Exceptional 2.5% |
| Ecuadorians | 99.9 /100 | #14 | Exceptional 2.5% |
| Barbadians | 99.9 /100 | #15 | Exceptional 2.5% |
Demographics Similar to Immigrants from Haiti by Hearing Disability
In terms of hearing disability, the demographic groups most similar to Immigrants from Haiti are Bolivian (2.6%, a difference of 0.020%), Immigrants from Caribbean (2.6%, a difference of 0.10%), Immigrants from Cameroon (2.6%, a difference of 0.11%), Immigrants from Venezuela (2.6%, a difference of 0.26%), and Immigrants from South Central Asia (2.6%, a difference of 0.37%).
| Demographics | Rating | Rank | Hearing Disability |
| Ghanaians | 99.8 /100 | #21 | Exceptional 2.5% |
| Immigrants | Sierra Leone | 99.8 /100 | #22 | Exceptional 2.6% |
| Immigrants | Nigeria | 99.8 /100 | #23 | Exceptional 2.6% |
| Immigrants | Ghana | 99.8 /100 | #24 | Exceptional 2.6% |
| Immigrants | El Salvador | 99.7 /100 | #25 | Exceptional 2.6% |
| Immigrants | Senegal | 99.7 /100 | #26 | Exceptional 2.6% |
| Immigrants | South Central Asia | 99.7 /100 | #27 | Exceptional 2.6% |
| Immigrants | Haiti | 99.7 /100 | #28 | Exceptional 2.6% |
| Bolivians | 99.7 /100 | #29 | Exceptional 2.6% |
| Immigrants | Caribbean | 99.7 /100 | #30 | Exceptional 2.6% |
| Immigrants | Cameroon | 99.7 /100 | #31 | Exceptional 2.6% |
| Immigrants | Venezuela | 99.7 /100 | #32 | Exceptional 2.6% |
| Filipinos | 99.6 /100 | #33 | Exceptional 2.6% |
| Immigrants | Pakistan | 99.6 /100 | #34 | Exceptional 2.6% |
| Salvadorans | 99.6 /100 | #35 | Exceptional 2.6% |