Vietnamese vs Icelander Vision Disability
COMPARE
Vietnamese
Icelander
Vision Disability
Vision Disability Comparison
Vietnamese
Icelanders
2.1%
VISION DISABILITY
86.7/ 100
METRIC RATING
135th/ 347
METRIC RANK
2.1%
VISION DISABILITY
66.1/ 100
METRIC RATING
163rd/ 347
METRIC RANK
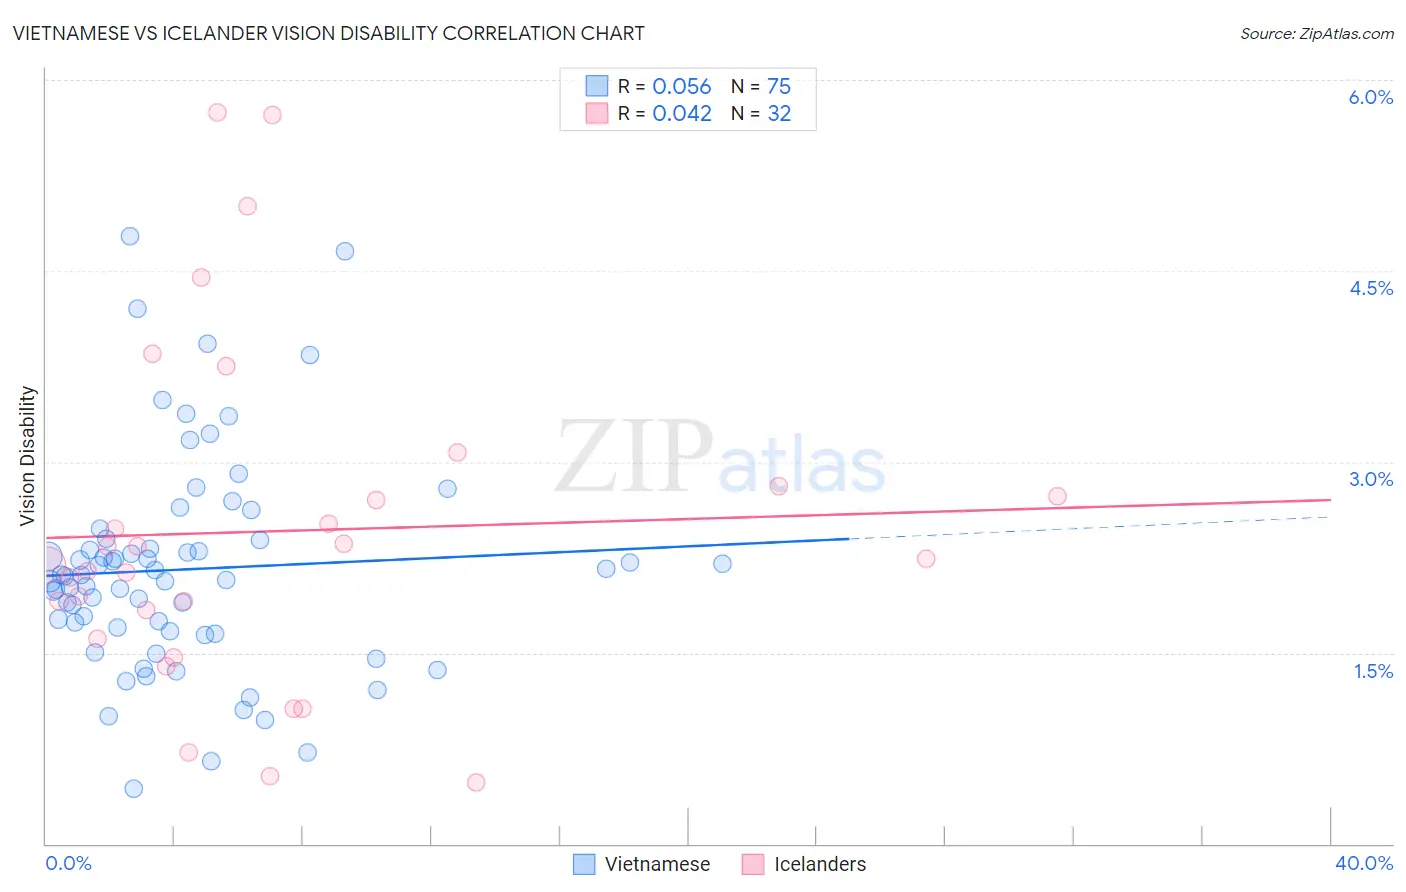
Vietnamese vs Icelander Vision Disability Correlation Chart
The statistical analysis conducted on geographies consisting of 170,695,405 people shows a slight positive correlation between the proportion of Vietnamese and percentage of population with vision disability in the United States with a correlation coefficient (R) of 0.056 and weighted average of 2.1%. Similarly, the statistical analysis conducted on geographies consisting of 159,612,613 people shows no correlation between the proportion of Icelanders and percentage of population with vision disability in the United States with a correlation coefficient (R) of 0.042 and weighted average of 2.1%, a difference of 2.0%.
Vision Disability Correlation Summary
| Measurement | Vietnamese | Icelander |
| Minimum | 0.44% | 0.48% |
| Maximum | 4.8% | 5.7% |
| Range | 4.3% | 5.3% |
| Mean | 2.2% | 2.5% |
| Median | 2.1% | 2.2% |
| Interquartile 25% (IQ1) | 1.7% | 1.7% |
| Interquartile 75% (IQ3) | 2.4% | 2.8% |
| Interquartile Range (IQR) | 0.72% | 1.0% |
| Standard Deviation (Sample) | 0.84% | 1.3% |
| Standard Deviation (Population) | 0.84% | 1.3% |
Similar Demographics by Vision Disability
Demographics Similar to Vietnamese by Vision Disability
In terms of vision disability, the demographic groups most similar to Vietnamese are Czech (2.1%, a difference of 0.050%), Immigrants from South Eastern Asia (2.1%, a difference of 0.050%), Arab (2.1%, a difference of 0.060%), Venezuelan (2.1%, a difference of 0.070%), and Syrian (2.1%, a difference of 0.12%).
| Demographics | Rating | Rank | Vision Disability |
| Immigrants | Chile | 89.0 /100 | #128 | Excellent 2.1% |
| Immigrants | Cameroon | 88.8 /100 | #129 | Excellent 2.1% |
| Immigrants | Kenya | 88.7 /100 | #130 | Excellent 2.1% |
| Immigrants | Hungary | 88.7 /100 | #131 | Excellent 2.1% |
| New Zealanders | 88.2 /100 | #132 | Excellent 2.1% |
| Syrians | 87.5 /100 | #133 | Excellent 2.1% |
| Venezuelans | 87.2 /100 | #134 | Excellent 2.1% |
| Vietnamese | 86.7 /100 | #135 | Excellent 2.1% |
| Czechs | 86.3 /100 | #136 | Excellent 2.1% |
| Immigrants | South Eastern Asia | 86.3 /100 | #137 | Excellent 2.1% |
| Arabs | 86.3 /100 | #138 | Excellent 2.1% |
| Immigrants | Morocco | 85.2 /100 | #139 | Excellent 2.1% |
| Immigrants | Netherlands | 84.2 /100 | #140 | Excellent 2.1% |
| Sierra Leoneans | 84.1 /100 | #141 | Excellent 2.1% |
| South Americans | 82.8 /100 | #142 | Excellent 2.1% |
Demographics Similar to Icelanders by Vision Disability
In terms of vision disability, the demographic groups most similar to Icelanders are Immigrants from Bangladesh (2.1%, a difference of 0.040%), Hungarian (2.1%, a difference of 0.090%), Immigrants from Iraq (2.1%, a difference of 0.090%), Iraqi (2.1%, a difference of 0.12%), and Austrian (2.1%, a difference of 0.21%).
| Demographics | Rating | Rank | Vision Disability |
| Pakistanis | 71.6 /100 | #156 | Good 2.1% |
| Serbians | 70.2 /100 | #157 | Good 2.1% |
| Immigrants | Uzbekistan | 69.9 /100 | #158 | Good 2.1% |
| South Africans | 69.8 /100 | #159 | Good 2.1% |
| Austrians | 69.0 /100 | #160 | Good 2.1% |
| Iraqis | 67.7 /100 | #161 | Good 2.1% |
| Hungarians | 67.4 /100 | #162 | Good 2.1% |
| Icelanders | 66.1 /100 | #163 | Good 2.1% |
| Immigrants | Bangladesh | 65.5 /100 | #164 | Good 2.1% |
| Immigrants | Iraq | 64.8 /100 | #165 | Good 2.1% |
| Immigrants | England | 62.8 /100 | #166 | Good 2.1% |
| Immigrants | Africa | 62.6 /100 | #167 | Good 2.1% |
| Brazilians | 62.2 /100 | #168 | Good 2.1% |
| South American Indians | 57.4 /100 | #169 | Average 2.2% |
| Swiss | 55.7 /100 | #170 | Average 2.2% |