Vietnamese vs Immigrants from Micronesia 8th Grade
COMPARE
Vietnamese
Immigrants from Micronesia
8th Grade
8th Grade Comparison
Vietnamese
Immigrants from Micronesia
93.5%
8TH GRADE
0.0/ 100
METRIC RATING
315th/ 347
METRIC RANK
95.6%
8TH GRADE
31.6/ 100
METRIC RATING
189th/ 347
METRIC RANK
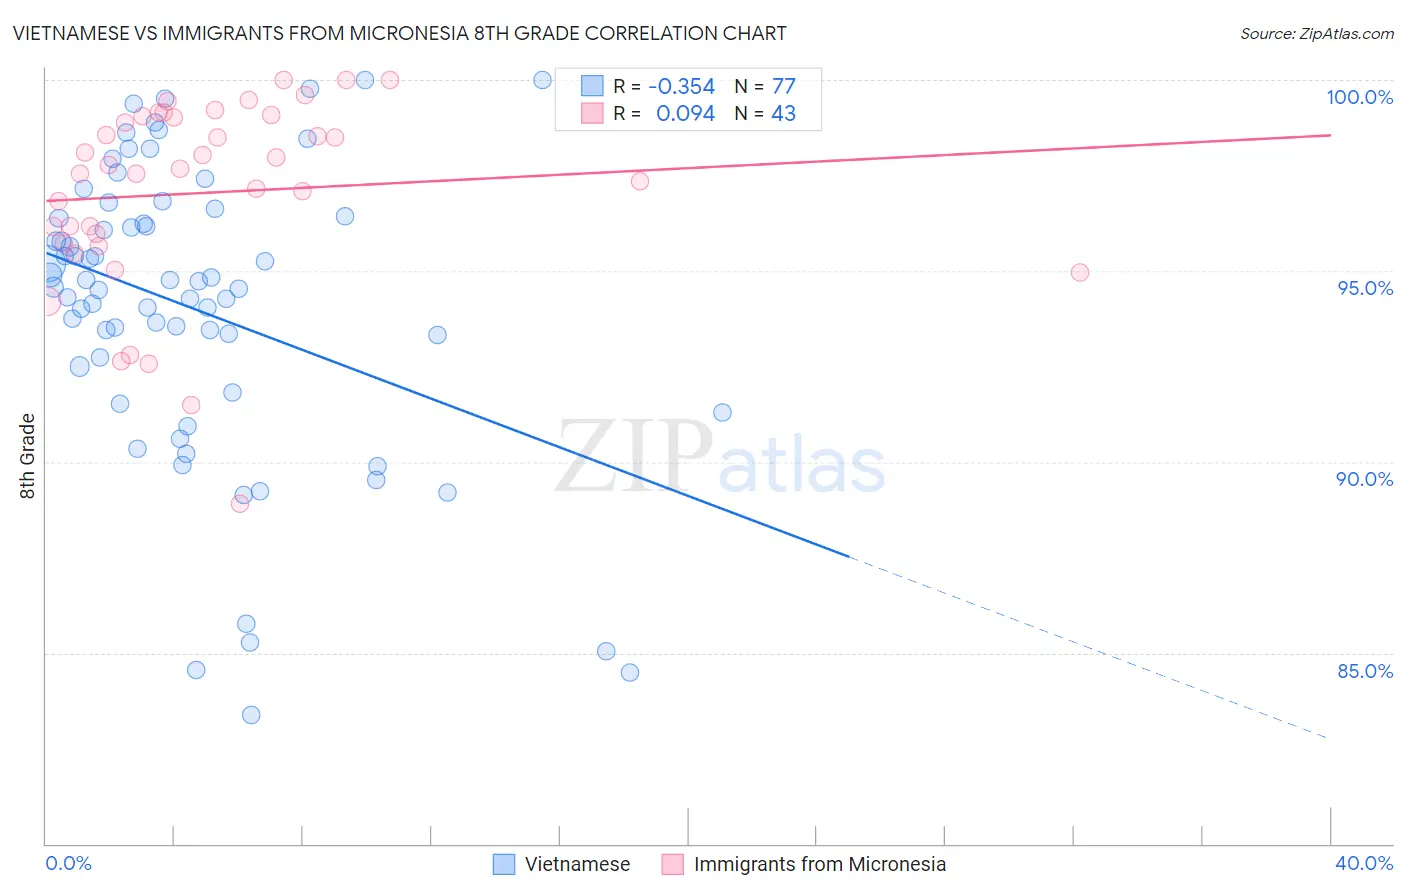
Vietnamese vs Immigrants from Micronesia 8th Grade Correlation Chart
The statistical analysis conducted on geographies consisting of 170,728,240 people shows a mild negative correlation between the proportion of Vietnamese and percentage of population with at least 8th grade education in the United States with a correlation coefficient (R) of -0.354 and weighted average of 93.5%. Similarly, the statistical analysis conducted on geographies consisting of 61,604,657 people shows a slight positive correlation between the proportion of Immigrants from Micronesia and percentage of population with at least 8th grade education in the United States with a correlation coefficient (R) of 0.094 and weighted average of 95.6%, a difference of 2.3%.
8th Grade Correlation Summary
| Measurement | Vietnamese | Immigrants from Micronesia |
| Minimum | 83.4% | 88.9% |
| Maximum | 100.0% | 100.0% |
| Range | 16.6% | 11.1% |
| Mean | 94.0% | 97.0% |
| Median | 94.6% | 97.7% |
| Interquartile 25% (IQ1) | 92.2% | 95.7% |
| Interquartile 75% (IQ3) | 96.4% | 99.1% |
| Interquartile Range (IQR) | 4.3% | 3.4% |
| Standard Deviation (Sample) | 3.8% | 2.5% |
| Standard Deviation (Population) | 3.8% | 2.5% |
Similar Demographics by 8th Grade
Demographics Similar to Vietnamese by 8th Grade
In terms of 8th grade, the demographic groups most similar to Vietnamese are Immigrants from Vietnam (93.5%, a difference of 0.010%), Immigrants from Caribbean (93.5%, a difference of 0.020%), Cape Verdean (93.5%, a difference of 0.050%), Japanese (93.6%, a difference of 0.090%), and Immigrants from Bangladesh (93.6%, a difference of 0.090%).
| Demographics | Rating | Rank | 8th Grade |
| Ecuadorians | 0.0 /100 | #308 | Tragic 93.6% |
| Immigrants | Immigrants | 0.0 /100 | #309 | Tragic 93.6% |
| Japanese | 0.0 /100 | #310 | Tragic 93.6% |
| Immigrants | Bangladesh | 0.0 /100 | #311 | Tragic 93.6% |
| Cape Verdeans | 0.0 /100 | #312 | Tragic 93.5% |
| Immigrants | Caribbean | 0.0 /100 | #313 | Tragic 93.5% |
| Immigrants | Vietnam | 0.0 /100 | #314 | Tragic 93.5% |
| Vietnamese | 0.0 /100 | #315 | Tragic 93.5% |
| Immigrants | Cambodia | 0.0 /100 | #316 | Tragic 93.3% |
| Immigrants | Ecuador | 0.0 /100 | #317 | Tragic 93.3% |
| Puerto Ricans | 0.0 /100 | #318 | Tragic 93.2% |
| Immigrants | Cuba | 0.0 /100 | #319 | Tragic 93.2% |
| Immigrants | Fiji | 0.0 /100 | #320 | Tragic 93.2% |
| Belizeans | 0.0 /100 | #321 | Tragic 93.1% |
| Nicaraguans | 0.0 /100 | #322 | Tragic 93.0% |
Demographics Similar to Immigrants from Micronesia by 8th Grade
In terms of 8th grade, the demographic groups most similar to Immigrants from Micronesia are Sudanese (95.6%, a difference of 0.010%), Liberian (95.6%, a difference of 0.010%), Immigrants from Venezuela (95.6%, a difference of 0.010%), Immigrants from Nepal (95.6%, a difference of 0.010%), and Black/African American (95.6%, a difference of 0.020%).
| Demographics | Rating | Rank | 8th Grade |
| Immigrants | Egypt | 37.9 /100 | #182 | Fair 95.7% |
| Immigrants | Iraq | 36.2 /100 | #183 | Fair 95.6% |
| Immigrants | Uganda | 36.0 /100 | #184 | Fair 95.6% |
| Blacks/African Americans | 34.8 /100 | #185 | Fair 95.6% |
| Brazilians | 34.8 /100 | #186 | Fair 95.6% |
| Sudanese | 33.0 /100 | #187 | Fair 95.6% |
| Liberians | 32.4 /100 | #188 | Fair 95.6% |
| Immigrants | Micronesia | 31.6 /100 | #189 | Fair 95.6% |
| Immigrants | Venezuela | 30.8 /100 | #190 | Fair 95.6% |
| Immigrants | Nepal | 30.2 /100 | #191 | Fair 95.6% |
| Pima | 28.6 /100 | #192 | Fair 95.6% |
| Panamanians | 28.4 /100 | #193 | Fair 95.6% |
| Guamanians/Chamorros | 26.6 /100 | #194 | Fair 95.6% |
| Immigrants | Zaire | 25.2 /100 | #195 | Fair 95.6% |
| Assyrians/Chaldeans/Syriacs | 24.5 /100 | #196 | Fair 95.6% |