Vietnamese vs Comanche Vision Disability
COMPARE
Vietnamese
Comanche
Vision Disability
Vision Disability Comparison
Vietnamese
Comanche
2.1%
VISION DISABILITY
86.7/ 100
METRIC RATING
135th/ 347
METRIC RANK
2.8%
VISION DISABILITY
0.0/ 100
METRIC RATING
321st/ 347
METRIC RANK
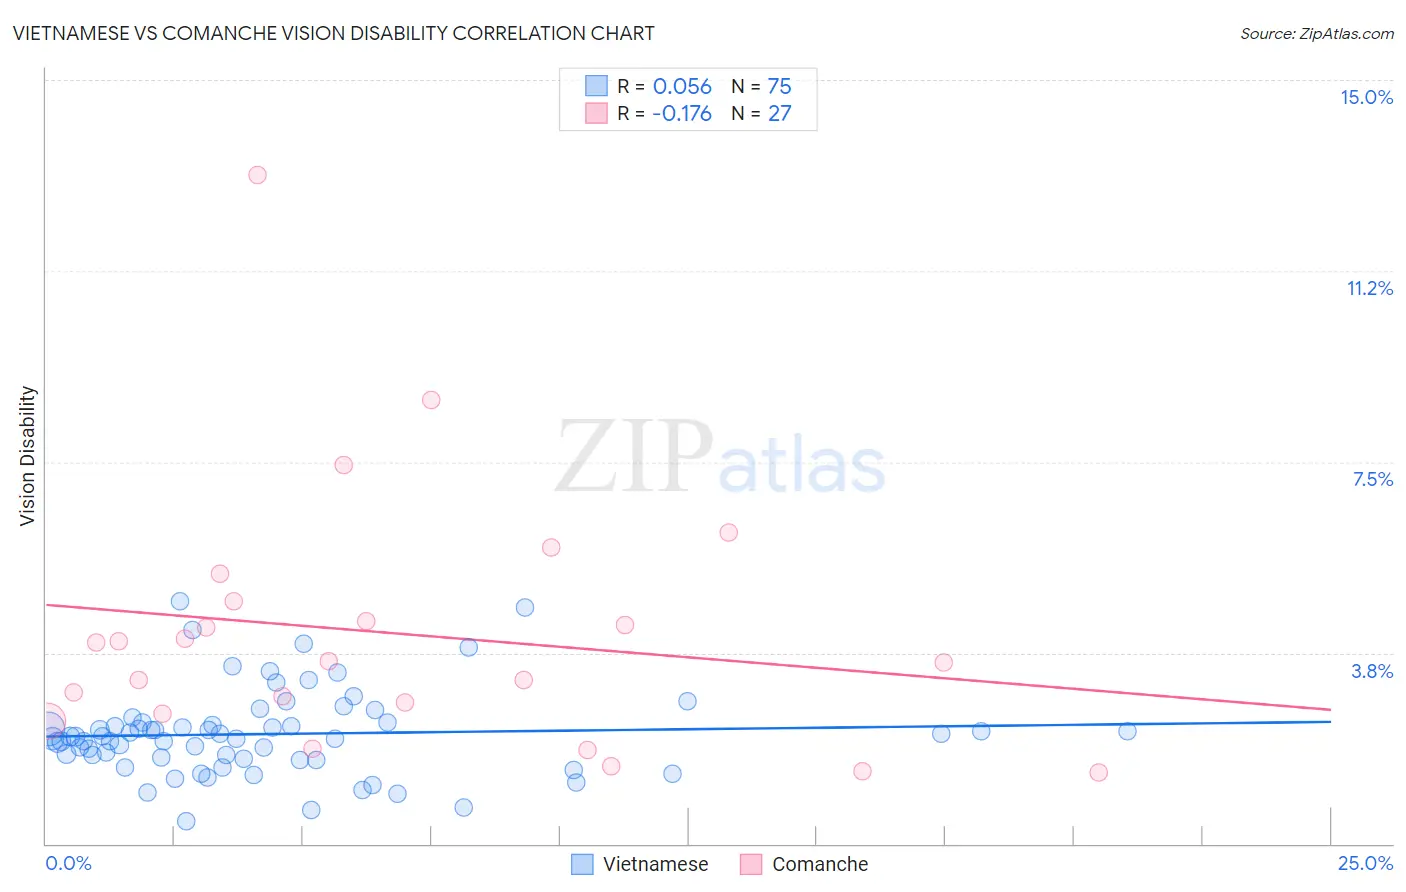
Vietnamese vs Comanche Vision Disability Correlation Chart
The statistical analysis conducted on geographies consisting of 170,695,405 people shows a slight positive correlation between the proportion of Vietnamese and percentage of population with vision disability in the United States with a correlation coefficient (R) of 0.056 and weighted average of 2.1%. Similarly, the statistical analysis conducted on geographies consisting of 109,767,498 people shows a poor negative correlation between the proportion of Comanche and percentage of population with vision disability in the United States with a correlation coefficient (R) of -0.176 and weighted average of 2.8%, a difference of 35.2%.
Vision Disability Correlation Summary
| Measurement | Vietnamese | Comanche |
| Minimum | 0.44% | 1.4% |
| Maximum | 4.8% | 13.1% |
| Range | 4.3% | 11.8% |
| Mean | 2.2% | 4.1% |
| Median | 2.1% | 3.6% |
| Interquartile 25% (IQ1) | 1.7% | 2.6% |
| Interquartile 75% (IQ3) | 2.4% | 4.8% |
| Interquartile Range (IQR) | 0.72% | 2.2% |
| Standard Deviation (Sample) | 0.84% | 2.5% |
| Standard Deviation (Population) | 0.84% | 2.5% |
Similar Demographics by Vision Disability
Demographics Similar to Vietnamese by Vision Disability
In terms of vision disability, the demographic groups most similar to Vietnamese are Czech (2.1%, a difference of 0.050%), Immigrants from South Eastern Asia (2.1%, a difference of 0.050%), Arab (2.1%, a difference of 0.060%), Venezuelan (2.1%, a difference of 0.070%), and Syrian (2.1%, a difference of 0.12%).
| Demographics | Rating | Rank | Vision Disability |
| Immigrants | Chile | 89.0 /100 | #128 | Excellent 2.1% |
| Immigrants | Cameroon | 88.8 /100 | #129 | Excellent 2.1% |
| Immigrants | Kenya | 88.7 /100 | #130 | Excellent 2.1% |
| Immigrants | Hungary | 88.7 /100 | #131 | Excellent 2.1% |
| New Zealanders | 88.2 /100 | #132 | Excellent 2.1% |
| Syrians | 87.5 /100 | #133 | Excellent 2.1% |
| Venezuelans | 87.2 /100 | #134 | Excellent 2.1% |
| Vietnamese | 86.7 /100 | #135 | Excellent 2.1% |
| Czechs | 86.3 /100 | #136 | Excellent 2.1% |
| Immigrants | South Eastern Asia | 86.3 /100 | #137 | Excellent 2.1% |
| Arabs | 86.3 /100 | #138 | Excellent 2.1% |
| Immigrants | Morocco | 85.2 /100 | #139 | Excellent 2.1% |
| Immigrants | Netherlands | 84.2 /100 | #140 | Excellent 2.1% |
| Sierra Leoneans | 84.1 /100 | #141 | Excellent 2.1% |
| South Americans | 82.8 /100 | #142 | Excellent 2.1% |
Demographics Similar to Comanche by Vision Disability
In terms of vision disability, the demographic groups most similar to Comanche are Paiute (2.9%, a difference of 0.42%), Tlingit-Haida (2.9%, a difference of 0.42%), Black/African American (2.8%, a difference of 2.0%), Hopi (2.9%, a difference of 2.4%), and Cherokee (2.9%, a difference of 2.4%).
| Demographics | Rating | Rank | Vision Disability |
| Inupiat | 0.0 /100 | #314 | Tragic 2.7% |
| Osage | 0.0 /100 | #315 | Tragic 2.7% |
| Shoshone | 0.0 /100 | #316 | Tragic 2.7% |
| Yup'ik | 0.0 /100 | #317 | Tragic 2.7% |
| Alaska Natives | 0.0 /100 | #318 | Tragic 2.7% |
| Tohono O'odham | 0.0 /100 | #319 | Tragic 2.8% |
| Blacks/African Americans | 0.0 /100 | #320 | Tragic 2.8% |
| Comanche | 0.0 /100 | #321 | Tragic 2.8% |
| Paiute | 0.0 /100 | #322 | Tragic 2.9% |
| Tlingit-Haida | 0.0 /100 | #323 | Tragic 2.9% |
| Hopi | 0.0 /100 | #324 | Tragic 2.9% |
| Cherokee | 0.0 /100 | #325 | Tragic 2.9% |
| Spanish Americans | 0.0 /100 | #326 | Tragic 2.9% |
| Natives/Alaskans | 0.0 /100 | #327 | Tragic 3.0% |
| Yuman | 0.0 /100 | #328 | Tragic 3.0% |