Immigrants from Caribbean vs Maltese Cognitive Disability
COMPARE
Immigrants from Caribbean
Maltese
Cognitive Disability
Cognitive Disability Comparison
Immigrants from Caribbean
Maltese
17.5%
COGNITIVE DISABILITY
11.0/ 100
METRIC RATING
203rd/ 347
METRIC RANK
16.2%
COGNITIVE DISABILITY
100.0/ 100
METRIC RATING
12th/ 347
METRIC RANK
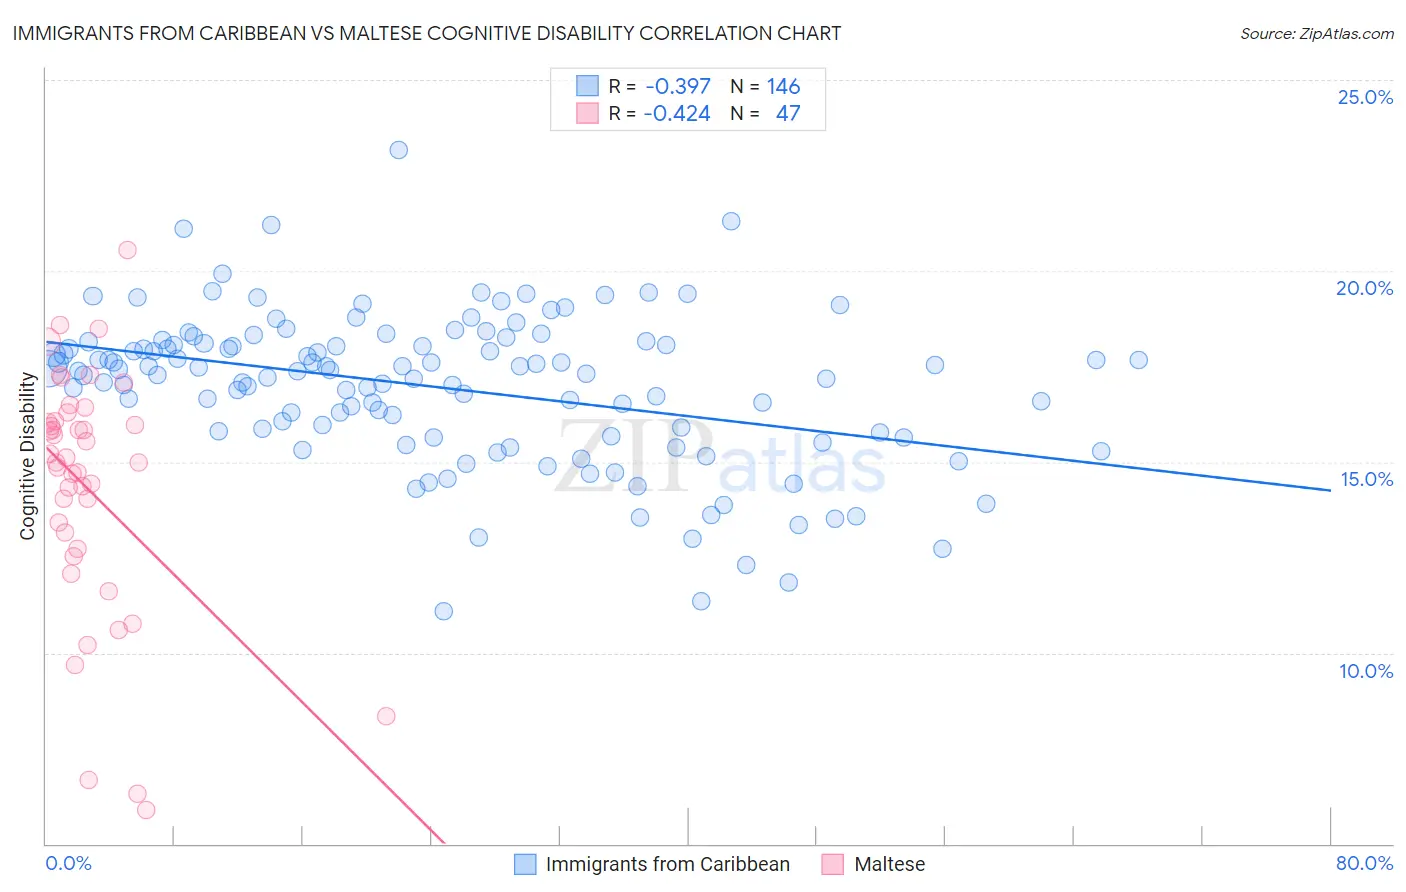
Immigrants from Caribbean vs Maltese Cognitive Disability Correlation Chart
The statistical analysis conducted on geographies consisting of 449,949,141 people shows a mild negative correlation between the proportion of Immigrants from Caribbean and percentage of population with cognitive disability in the United States with a correlation coefficient (R) of -0.397 and weighted average of 17.5%. Similarly, the statistical analysis conducted on geographies consisting of 126,468,065 people shows a moderate negative correlation between the proportion of Maltese and percentage of population with cognitive disability in the United States with a correlation coefficient (R) of -0.424 and weighted average of 16.2%, a difference of 8.0%.
Cognitive Disability Correlation Summary
| Measurement | Immigrants from Caribbean | Maltese |
| Minimum | 11.1% | 5.9% |
| Maximum | 23.2% | 20.5% |
| Range | 12.1% | 14.6% |
| Mean | 16.9% | 14.3% |
| Median | 17.4% | 15.0% |
| Interquartile 25% (IQ1) | 15.8% | 12.7% |
| Interquartile 75% (IQ3) | 18.1% | 16.1% |
| Interquartile Range (IQR) | 2.3% | 3.4% |
| Standard Deviation (Sample) | 2.0% | 3.2% |
| Standard Deviation (Population) | 2.0% | 3.2% |
Similar Demographics by Cognitive Disability
Demographics Similar to Immigrants from Caribbean by Cognitive Disability
In terms of cognitive disability, the demographic groups most similar to Immigrants from Caribbean are Immigrants from Zimbabwe (17.5%, a difference of 0.0%), Puget Sound Salish (17.5%, a difference of 0.010%), Alaska Native (17.5%, a difference of 0.050%), Immigrants from Morocco (17.5%, a difference of 0.070%), and Immigrants from Latin America (17.6%, a difference of 0.10%).
| Demographics | Rating | Rank | Cognitive Disability |
| Guyanese | 17.5 /100 | #196 | Poor 17.5% |
| Immigrants | Afghanistan | 16.7 /100 | #197 | Poor 17.5% |
| Immigrants | Panama | 14.8 /100 | #198 | Poor 17.5% |
| Immigrants | Singapore | 14.3 /100 | #199 | Poor 17.5% |
| Haitians | 14.1 /100 | #200 | Poor 17.5% |
| South American Indians | 13.0 /100 | #201 | Poor 17.5% |
| Immigrants | Morocco | 12.0 /100 | #202 | Poor 17.5% |
| Immigrants | Caribbean | 11.0 /100 | #203 | Poor 17.5% |
| Immigrants | Zimbabwe | 11.0 /100 | #204 | Poor 17.5% |
| Puget Sound Salish | 10.9 /100 | #205 | Poor 17.5% |
| Alaska Natives | 10.4 /100 | #206 | Poor 17.5% |
| Immigrants | Latin America | 9.7 /100 | #207 | Tragic 17.6% |
| Immigrants | Cameroon | 9.3 /100 | #208 | Tragic 17.6% |
| Immigrants | Trinidad and Tobago | 8.7 /100 | #209 | Tragic 17.6% |
| Immigrants | Jamaica | 8.5 /100 | #210 | Tragic 17.6% |
Demographics Similar to Maltese by Cognitive Disability
In terms of cognitive disability, the demographic groups most similar to Maltese are Lithuanian (16.3%, a difference of 0.090%), Immigrants from Austria (16.3%, a difference of 0.15%), Immigrants from Czechoslovakia (16.2%, a difference of 0.16%), Immigrants from Greece (16.3%, a difference of 0.18%), and Immigrants from Scotland (16.2%, a difference of 0.25%).
| Demographics | Rating | Rank | Cognitive Disability |
| Immigrants | Hong Kong | 100.0 /100 | #5 | Exceptional 16.0% |
| Thais | 100.0 /100 | #6 | Exceptional 16.1% |
| Immigrants | Ireland | 100.0 /100 | #7 | Exceptional 16.1% |
| Immigrants | Poland | 100.0 /100 | #8 | Exceptional 16.1% |
| Assyrians/Chaldeans/Syriacs | 100.0 /100 | #9 | Exceptional 16.2% |
| Immigrants | Scotland | 100.0 /100 | #10 | Exceptional 16.2% |
| Immigrants | Czechoslovakia | 100.0 /100 | #11 | Exceptional 16.2% |
| Maltese | 100.0 /100 | #12 | Exceptional 16.2% |
| Lithuanians | 100.0 /100 | #13 | Exceptional 16.3% |
| Immigrants | Austria | 100.0 /100 | #14 | Exceptional 16.3% |
| Immigrants | Greece | 100.0 /100 | #15 | Exceptional 16.3% |
| Eastern Europeans | 100.0 /100 | #16 | Exceptional 16.3% |
| Immigrants | North Macedonia | 100.0 /100 | #17 | Exceptional 16.3% |
| Immigrants | Northern Europe | 100.0 /100 | #18 | Exceptional 16.3% |
| Immigrants | Bolivia | 100.0 /100 | #19 | Exceptional 16.3% |