Immigrants from Honduras vs Immigrants from Cuba Vision Disability
COMPARE
Immigrants from Honduras
Immigrants from Cuba
Vision Disability
Vision Disability Comparison
Immigrants from Honduras
Immigrants from Cuba
2.5%
VISION DISABILITY
0.0/ 100
METRIC RATING
291st/ 347
METRIC RANK
2.5%
VISION DISABILITY
0.0/ 100
METRIC RATING
290th/ 347
METRIC RANK
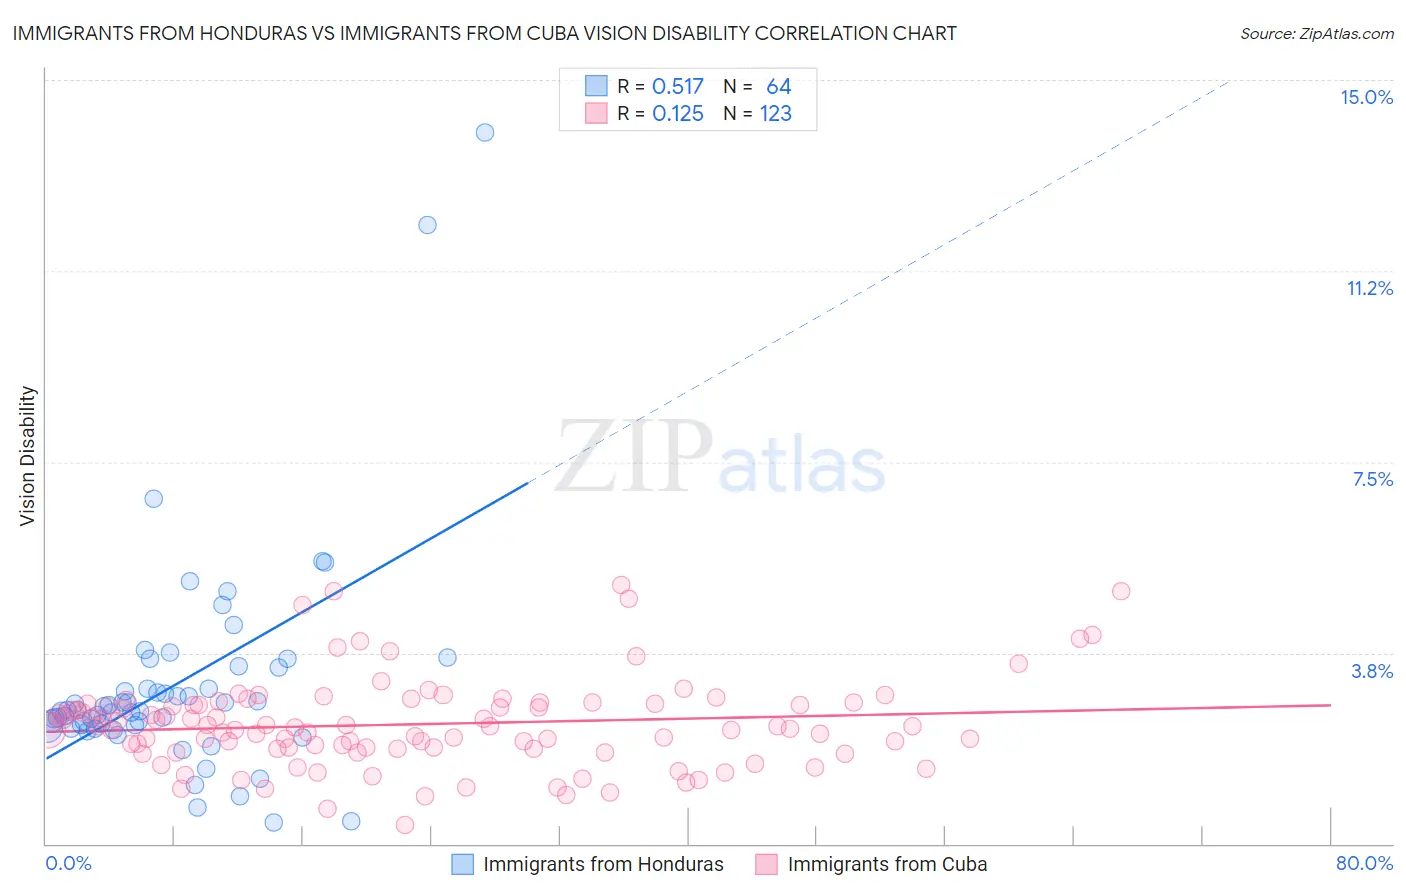
Immigrants from Honduras vs Immigrants from Cuba Vision Disability Correlation Chart
The statistical analysis conducted on geographies consisting of 322,475,782 people shows a substantial positive correlation between the proportion of Immigrants from Honduras and percentage of population with vision disability in the United States with a correlation coefficient (R) of 0.517 and weighted average of 2.5%. Similarly, the statistical analysis conducted on geographies consisting of 325,877,901 people shows a poor positive correlation between the proportion of Immigrants from Cuba and percentage of population with vision disability in the United States with a correlation coefficient (R) of 0.125 and weighted average of 2.5%, a difference of 0.39%.
Vision Disability Correlation Summary
| Measurement | Immigrants from Honduras | Immigrants from Cuba |
| Minimum | 0.42% | 0.38% |
| Maximum | 14.0% | 5.1% |
| Range | 13.5% | 4.7% |
| Mean | 3.1% | 2.3% |
| Median | 2.6% | 2.3% |
| Interquartile 25% (IQ1) | 2.3% | 1.9% |
| Interquartile 75% (IQ3) | 3.3% | 2.7% |
| Interquartile Range (IQR) | 0.94% | 0.87% |
| Standard Deviation (Sample) | 2.1% | 0.87% |
| Standard Deviation (Population) | 2.1% | 0.87% |
Demographics Similar to Immigrants from Honduras and Immigrants from Cuba by Vision Disability
In terms of vision disability, the demographic groups most similar to Immigrants from Honduras are Crow (2.5%, a difference of 0.10%), Yaqui (2.5%, a difference of 0.12%), Ottawa (2.5%, a difference of 0.46%), Nonimmigrants (2.5%, a difference of 0.53%), and Delaware (2.5%, a difference of 0.67%). Similarly, the demographic groups most similar to Immigrants from Cuba are Nonimmigrants (2.5%, a difference of 0.14%), Crow (2.5%, a difference of 0.49%), Yaqui (2.5%, a difference of 0.52%), French American Indian (2.5%, a difference of 0.55%), and Honduran (2.5%, a difference of 0.57%).
| Demographics | Rating | Rank | Vision Disability |
| Cape Verdeans | 0.0 /100 | #280 | Tragic 2.4% |
| U.S. Virgin Islanders | 0.0 /100 | #281 | Tragic 2.5% |
| Immigrants | Caribbean | 0.0 /100 | #282 | Tragic 2.5% |
| Puget Sound Salish | 0.0 /100 | #283 | Tragic 2.5% |
| Yakama | 0.0 /100 | #284 | Tragic 2.5% |
| Immigrants | Central America | 0.0 /100 | #285 | Tragic 2.5% |
| Sioux | 0.0 /100 | #286 | Tragic 2.5% |
| Hondurans | 0.0 /100 | #287 | Tragic 2.5% |
| French American Indians | 0.0 /100 | #288 | Tragic 2.5% |
| Immigrants | Nonimmigrants | 0.0 /100 | #289 | Tragic 2.5% |
| Immigrants | Cuba | 0.0 /100 | #290 | Tragic 2.5% |
| Immigrants | Honduras | 0.0 /100 | #291 | Tragic 2.5% |
| Crow | 0.0 /100 | #292 | Tragic 2.5% |
| Yaqui | 0.0 /100 | #293 | Tragic 2.5% |
| Ottawa | 0.0 /100 | #294 | Tragic 2.5% |
| Delaware | 0.0 /100 | #295 | Tragic 2.5% |
| Immigrants | Mexico | 0.0 /100 | #296 | Tragic 2.5% |
| Immigrants | Dominica | 0.0 /100 | #297 | Tragic 2.5% |
| Mexicans | 0.0 /100 | #298 | Tragic 2.5% |
| Cree | 0.0 /100 | #299 | Tragic 2.5% |
| Africans | 0.0 /100 | #300 | Tragic 2.5% |