U.S. Virgin Islander vs Osage Self-Care Disability
COMPARE
U.S. Virgin Islander
Osage
Self-Care Disability
Self-Care Disability Comparison
U.S. Virgin Islanders
Osage
2.7%
SELF-CARE DISABILITY
0.1/ 100
METRIC RATING
269th/ 347
METRIC RANK
2.6%
SELF-CARE DISABILITY
3.6/ 100
METRIC RATING
224th/ 347
METRIC RANK
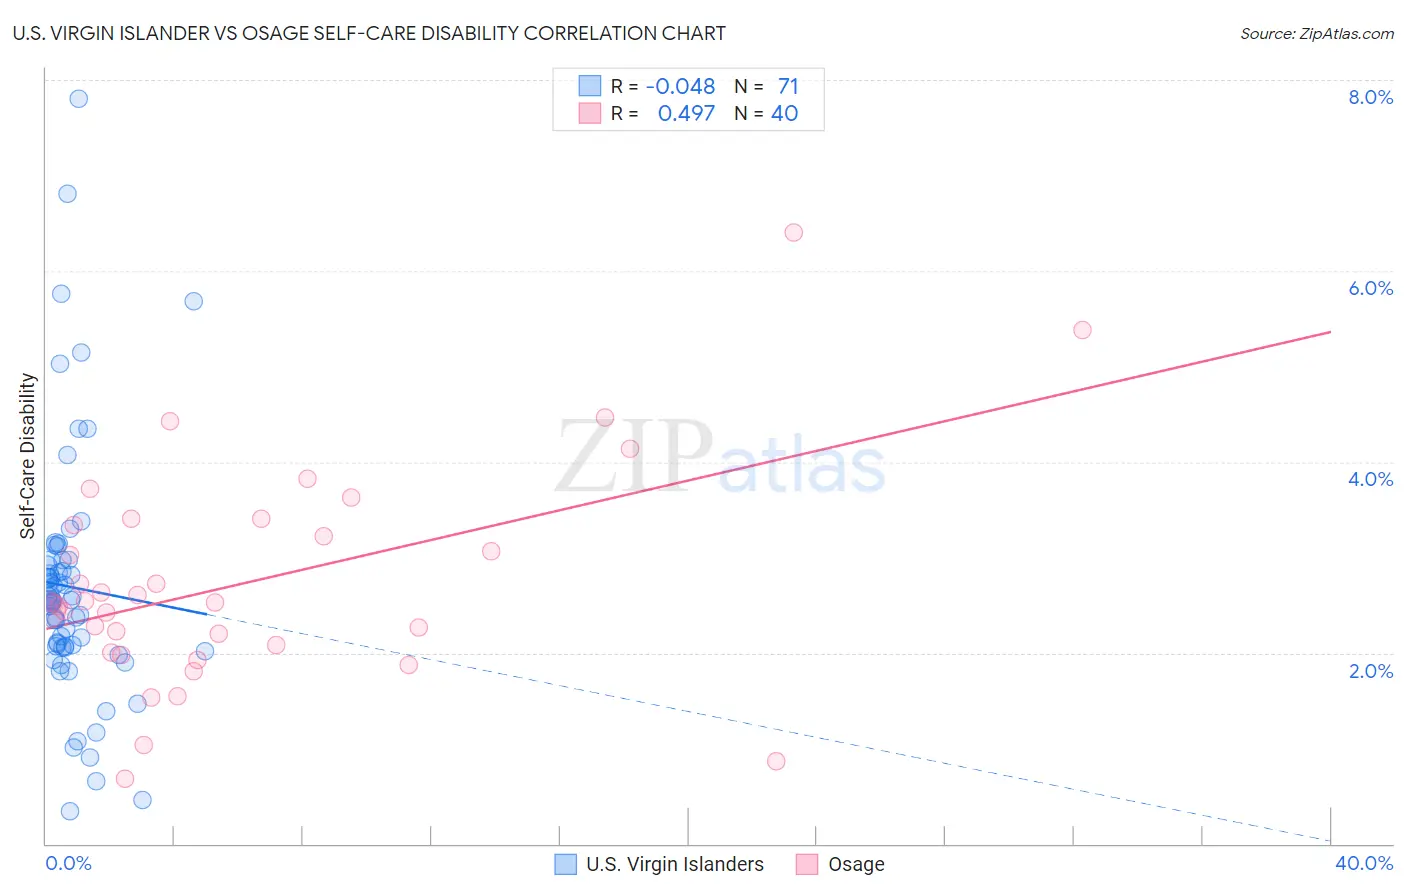
U.S. Virgin Islander vs Osage Self-Care Disability Correlation Chart
The statistical analysis conducted on geographies consisting of 87,500,828 people shows no correlation between the proportion of U.S. Virgin Islanders and percentage of population with self-care disability in the United States with a correlation coefficient (R) of -0.048 and weighted average of 2.7%. Similarly, the statistical analysis conducted on geographies consisting of 91,779,212 people shows a moderate positive correlation between the proportion of Osage and percentage of population with self-care disability in the United States with a correlation coefficient (R) of 0.497 and weighted average of 2.6%, a difference of 4.1%.
Self-Care Disability Correlation Summary
| Measurement | U.S. Virgin Islander | Osage |
| Minimum | 0.34% | 0.68% |
| Maximum | 7.8% | 6.4% |
| Range | 7.5% | 5.7% |
| Mean | 2.7% | 2.7% |
| Median | 2.6% | 2.5% |
| Interquartile 25% (IQ1) | 2.1% | 2.0% |
| Interquartile 75% (IQ3) | 3.0% | 3.4% |
| Interquartile Range (IQR) | 0.92% | 1.3% |
| Standard Deviation (Sample) | 1.3% | 1.2% |
| Standard Deviation (Population) | 1.3% | 1.1% |
Similar Demographics by Self-Care Disability
Demographics Similar to U.S. Virgin Islanders by Self-Care Disability
In terms of self-care disability, the demographic groups most similar to U.S. Virgin Islanders are Immigrants from Micronesia (2.7%, a difference of 0.040%), Trinidadian and Tobagonian (2.7%, a difference of 0.10%), Immigrants from Laos (2.7%, a difference of 0.14%), Immigrants from Mexico (2.7%, a difference of 0.17%), and Yaqui (2.7%, a difference of 0.22%).
| Demographics | Rating | Rank | Self-Care Disability |
| Shoshone | 0.2 /100 | #262 | Tragic 2.7% |
| Immigrants | Latin America | 0.2 /100 | #263 | Tragic 2.7% |
| Immigrants | Iran | 0.2 /100 | #264 | Tragic 2.7% |
| Immigrants | Nicaragua | 0.2 /100 | #265 | Tragic 2.7% |
| Immigrants | Cambodia | 0.1 /100 | #266 | Tragic 2.7% |
| Yaqui | 0.1 /100 | #267 | Tragic 2.7% |
| Immigrants | Mexico | 0.1 /100 | #268 | Tragic 2.7% |
| U.S. Virgin Islanders | 0.1 /100 | #269 | Tragic 2.7% |
| Immigrants | Micronesia | 0.1 /100 | #270 | Tragic 2.7% |
| Trinidadians and Tobagonians | 0.1 /100 | #271 | Tragic 2.7% |
| Immigrants | Laos | 0.1 /100 | #272 | Tragic 2.7% |
| Mexicans | 0.1 /100 | #273 | Tragic 2.7% |
| Yakama | 0.1 /100 | #274 | Tragic 2.7% |
| Immigrants | Trinidad and Tobago | 0.1 /100 | #275 | Tragic 2.7% |
| Japanese | 0.1 /100 | #276 | Tragic 2.7% |
Demographics Similar to Osage by Self-Care Disability
In terms of self-care disability, the demographic groups most similar to Osage are French Canadian (2.6%, a difference of 0.050%), Spaniard (2.6%, a difference of 0.060%), Honduran (2.6%, a difference of 0.070%), Subsaharan African (2.6%, a difference of 0.11%), and Immigrants from Moldova (2.6%, a difference of 0.12%).
| Demographics | Rating | Rank | Self-Care Disability |
| Celtics | 4.4 /100 | #217 | Tragic 2.6% |
| Scotch-Irish | 4.1 /100 | #218 | Tragic 2.6% |
| Immigrants | Moldova | 4.0 /100 | #219 | Tragic 2.6% |
| Sub-Saharan Africans | 4.0 /100 | #220 | Tragic 2.6% |
| Hondurans | 3.8 /100 | #221 | Tragic 2.6% |
| Spaniards | 3.8 /100 | #222 | Tragic 2.6% |
| French Canadians | 3.8 /100 | #223 | Tragic 2.6% |
| Osage | 3.6 /100 | #224 | Tragic 2.6% |
| Iraqis | 3.2 /100 | #225 | Tragic 2.6% |
| Chinese | 2.9 /100 | #226 | Tragic 2.6% |
| Immigrants | Philippines | 2.7 /100 | #227 | Tragic 2.6% |
| Guatemalans | 2.7 /100 | #228 | Tragic 2.6% |
| Guamanians/Chamorros | 2.5 /100 | #229 | Tragic 2.6% |
| Immigrants | Ecuador | 2.5 /100 | #230 | Tragic 2.6% |
| Immigrants | Guatemala | 2.2 /100 | #231 | Tragic 2.6% |