U.S. Virgin Islander vs Cape Verdean Disability Age 65 to 74
COMPARE
U.S. Virgin Islander
Cape Verdean
Disability Age 65 to 74
Disability Age 65 to 74 Comparison
U.S. Virgin Islanders
Cape Verdeans
25.9%
DISABILITY AGE 65 TO 74
0.1/ 100
METRIC RATING
279th/ 347
METRIC RANK
25.4%
DISABILITY AGE 65 TO 74
0.2/ 100
METRIC RATING
261st/ 347
METRIC RANK
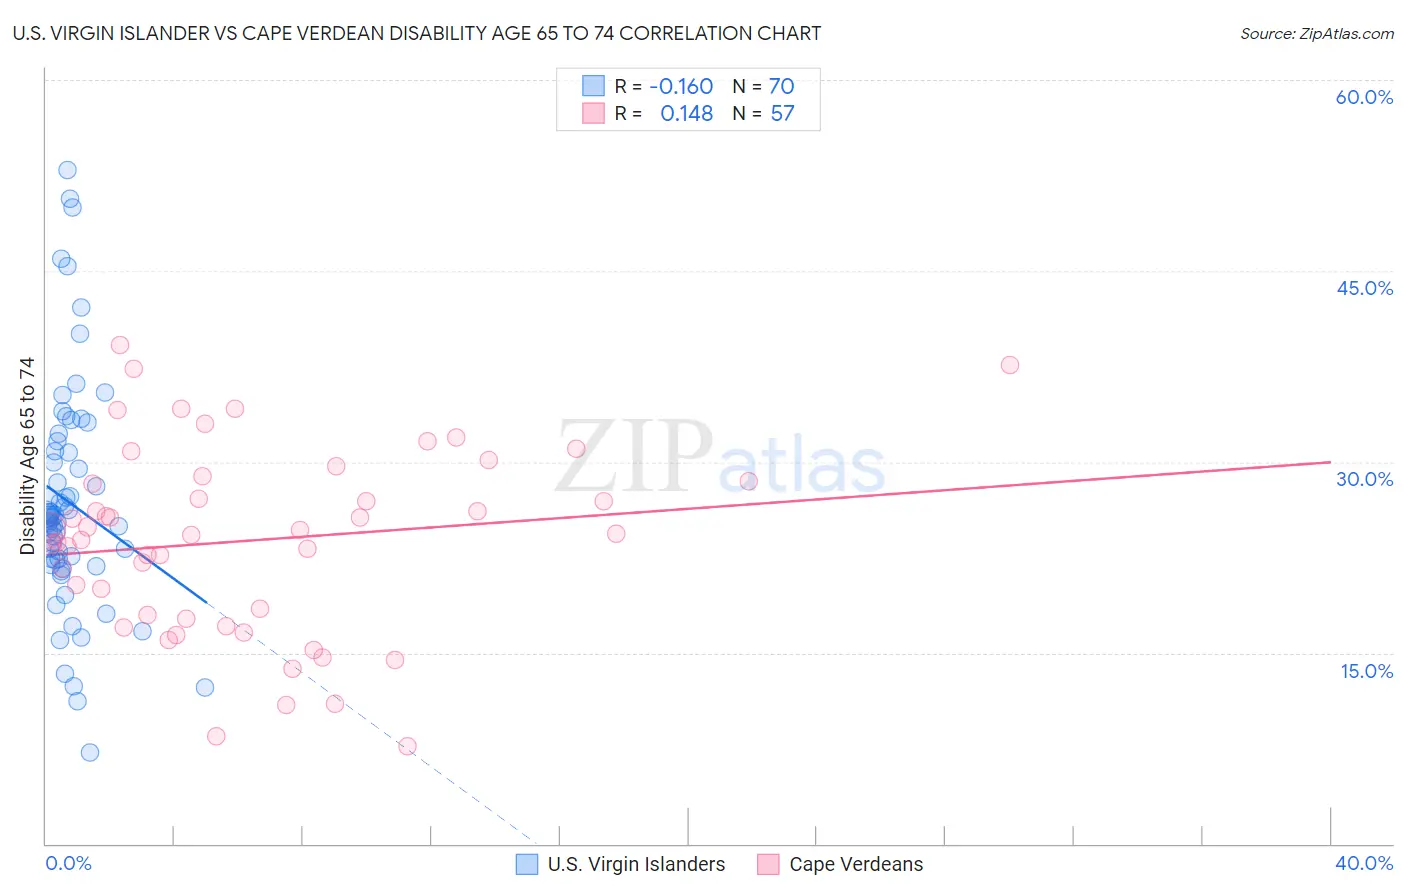
U.S. Virgin Islander vs Cape Verdean Disability Age 65 to 74 Correlation Chart
The statistical analysis conducted on geographies consisting of 87,465,301 people shows a poor negative correlation between the proportion of U.S. Virgin Islanders and percentage of population with a disability between the ages 65 and 75 in the United States with a correlation coefficient (R) of -0.160 and weighted average of 25.9%. Similarly, the statistical analysis conducted on geographies consisting of 107,487,290 people shows a poor positive correlation between the proportion of Cape Verdeans and percentage of population with a disability between the ages 65 and 75 in the United States with a correlation coefficient (R) of 0.148 and weighted average of 25.4%, a difference of 1.7%.
Disability Age 65 to 74 Correlation Summary
| Measurement | U.S. Virgin Islander | Cape Verdean |
| Minimum | 7.1% | 7.7% |
| Maximum | 52.9% | 39.2% |
| Range | 45.8% | 31.5% |
| Mean | 26.8% | 23.8% |
| Median | 25.6% | 24.3% |
| Interquartile 25% (IQ1) | 22.3% | 17.8% |
| Interquartile 75% (IQ3) | 30.9% | 28.7% |
| Interquartile Range (IQR) | 8.6% | 10.9% |
| Standard Deviation (Sample) | 9.0% | 7.3% |
| Standard Deviation (Population) | 9.0% | 7.3% |
Demographics Similar to U.S. Virgin Islanders and Cape Verdeans by Disability Age 65 to 74
In terms of disability age 65 to 74, the demographic groups most similar to U.S. Virgin Islanders are Immigrants from Belize (25.8%, a difference of 0.080%), Cree (25.9%, a difference of 0.080%), Belizean (25.8%, a difference of 0.10%), French American Indian (25.8%, a difference of 0.19%), and American (25.8%, a difference of 0.21%). Similarly, the demographic groups most similar to Cape Verdeans are Malaysian (25.4%, a difference of 0.080%), Samoan (25.4%, a difference of 0.10%), Iroquois (25.4%, a difference of 0.10%), Hawaiian (25.5%, a difference of 0.45%), and Guatemalan (25.5%, a difference of 0.49%).
| Demographics | Rating | Rank | Disability Age 65 to 74 |
| Malaysians | 0.2 /100 | #260 | Tragic 25.4% |
| Cape Verdeans | 0.2 /100 | #261 | Tragic 25.4% |
| Samoans | 0.2 /100 | #262 | Tragic 25.4% |
| Iroquois | 0.2 /100 | #263 | Tragic 25.4% |
| Hawaiians | 0.2 /100 | #264 | Tragic 25.5% |
| Guatemalans | 0.2 /100 | #265 | Tragic 25.5% |
| Immigrants | Latin America | 0.1 /100 | #266 | Tragic 25.6% |
| Ottawa | 0.1 /100 | #267 | Tragic 25.6% |
| Liberians | 0.1 /100 | #268 | Tragic 25.6% |
| Hmong | 0.1 /100 | #269 | Tragic 25.7% |
| Immigrants | Guatemala | 0.1 /100 | #270 | Tragic 25.7% |
| Immigrants | Liberia | 0.1 /100 | #271 | Tragic 25.7% |
| Immigrants | Dominica | 0.1 /100 | #272 | Tragic 25.7% |
| Japanese | 0.1 /100 | #273 | Tragic 25.7% |
| Americans | 0.1 /100 | #274 | Tragic 25.8% |
| Hondurans | 0.1 /100 | #275 | Tragic 25.8% |
| French American Indians | 0.1 /100 | #276 | Tragic 25.8% |
| Belizeans | 0.1 /100 | #277 | Tragic 25.8% |
| Immigrants | Belize | 0.1 /100 | #278 | Tragic 25.8% |
| U.S. Virgin Islanders | 0.1 /100 | #279 | Tragic 25.9% |
| Cree | 0.1 /100 | #280 | Tragic 25.9% |