Ukrainian vs Immigrants from Northern Europe Unemployment Among Ages 30 to 34 years
COMPARE
Ukrainian
Immigrants from Northern Europe
Unemployment Among Ages 30 to 34 years
Unemployment Among Ages 30 to 34 years Comparison
Ukrainians
Immigrants from Northern Europe
5.4%
UNEMPLOYMENT AMONG AGES 30 TO 34 YEARS
69.2/ 100
METRIC RATING
147th/ 347
METRIC RANK
5.3%
UNEMPLOYMENT AMONG AGES 30 TO 34 YEARS
77.3/ 100
METRIC RATING
133rd/ 347
METRIC RANK
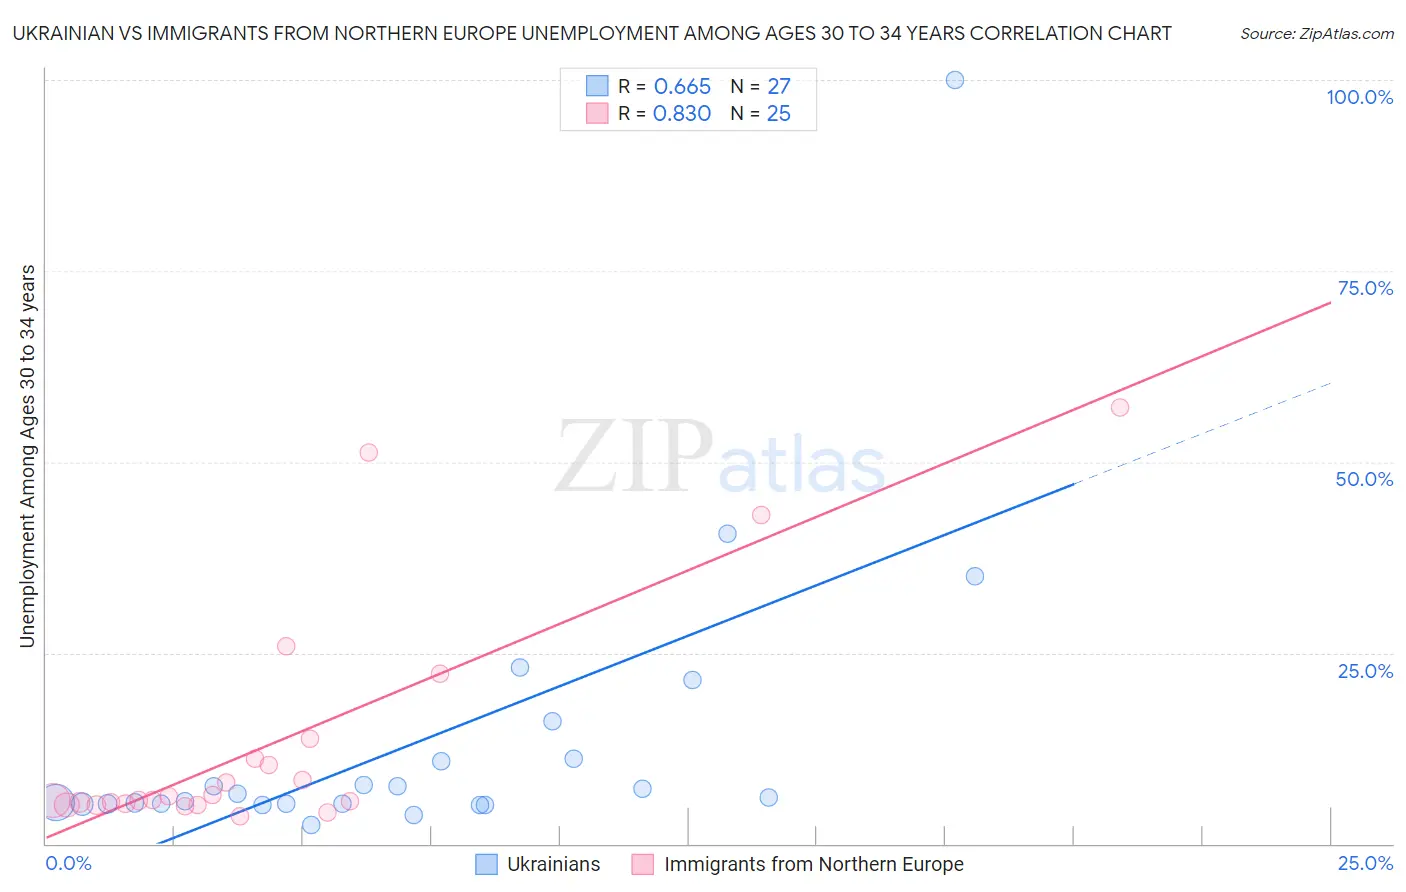
Ukrainian vs Immigrants from Northern Europe Unemployment Among Ages 30 to 34 years Correlation Chart
The statistical analysis conducted on geographies consisting of 412,531,563 people shows a significant positive correlation between the proportion of Ukrainians and unemployment rate among population between the ages 30 and 34 in the United States with a correlation coefficient (R) of 0.665 and weighted average of 5.4%. Similarly, the statistical analysis conducted on geographies consisting of 438,064,437 people shows a very strong positive correlation between the proportion of Immigrants from Northern Europe and unemployment rate among population between the ages 30 and 34 in the United States with a correlation coefficient (R) of 0.830 and weighted average of 5.3%, a difference of 0.73%.
Unemployment Among Ages 30 to 34 years Correlation Summary
| Measurement | Ukrainian | Immigrants from Northern Europe |
| Minimum | 2.5% | 3.6% |
| Maximum | 100.0% | 57.1% |
| Range | 97.5% | 53.5% |
| Mean | 13.5% | 13.2% |
| Median | 6.1% | 5.7% |
| Interquartile 25% (IQ1) | 5.2% | 5.2% |
| Interquartile 75% (IQ3) | 11.1% | 12.4% |
| Interquartile Range (IQR) | 5.9% | 7.3% |
| Standard Deviation (Sample) | 19.7% | 15.2% |
| Standard Deviation (Population) | 19.3% | 14.9% |
Demographics Similar to Ukrainians and Immigrants from Northern Europe by Unemployment Among Ages 30 to 34 years
In terms of unemployment among ages 30 to 34 years, the demographic groups most similar to Ukrainians are Immigrants from Iran (5.4%, a difference of 0.010%), Immigrants from Colombia (5.4%, a difference of 0.030%), Colombian (5.4%, a difference of 0.040%), Celtic (5.4%, a difference of 0.080%), and Syrian (5.4%, a difference of 0.090%). Similarly, the demographic groups most similar to Immigrants from Northern Europe are Carpatho Rusyn (5.3%, a difference of 0.0%), Immigrants from Eastern Europe (5.3%, a difference of 0.010%), German (5.3%, a difference of 0.050%), Bangladeshi (5.3%, a difference of 0.070%), and Palestinian (5.4%, a difference of 0.21%).
| Demographics | Rating | Rank | Unemployment Among Ages 30 to 34 years |
| Germans | 77.8 /100 | #130 | Good 5.3% |
| Immigrants | Eastern Europe | 77.4 /100 | #131 | Good 5.3% |
| Carpatho Rusyns | 77.3 /100 | #132 | Good 5.3% |
| Immigrants | Northern Europe | 77.3 /100 | #133 | Good 5.3% |
| Bangladeshis | 76.6 /100 | #134 | Good 5.3% |
| Palestinians | 75.1 /100 | #135 | Good 5.4% |
| Pakistanis | 74.6 /100 | #136 | Good 5.4% |
| Immigrants | Canada | 74.6 /100 | #137 | Good 5.4% |
| Serbians | 72.9 /100 | #138 | Good 5.4% |
| Lithuanians | 72.4 /100 | #139 | Good 5.4% |
| Immigrants | North America | 72.2 /100 | #140 | Good 5.4% |
| Immigrants | Europe | 72.1 /100 | #141 | Good 5.4% |
| Immigrants | Greece | 72.0 /100 | #142 | Good 5.4% |
| Russians | 71.1 /100 | #143 | Good 5.4% |
| Immigrants | Russia | 71.0 /100 | #144 | Good 5.4% |
| Syrians | 70.3 /100 | #145 | Good 5.4% |
| Celtics | 70.2 /100 | #146 | Good 5.4% |
| Ukrainians | 69.2 /100 | #147 | Good 5.4% |
| Immigrants | Iran | 69.1 /100 | #148 | Good 5.4% |
| Immigrants | Colombia | 68.9 /100 | #149 | Good 5.4% |
| Colombians | 68.7 /100 | #150 | Good 5.4% |