Immigrants from Haiti vs Immigrants from Guyana Hearing Disability
COMPARE
Immigrants from Haiti
Immigrants from Guyana
Hearing Disability
Hearing Disability Comparison
Immigrants from Haiti
Immigrants from Guyana
2.6%
HEARING DISABILITY
99.7/ 100
METRIC RATING
28th/ 347
METRIC RANK
2.3%
HEARING DISABILITY
100.0/ 100
METRIC RATING
4th/ 347
METRIC RANK
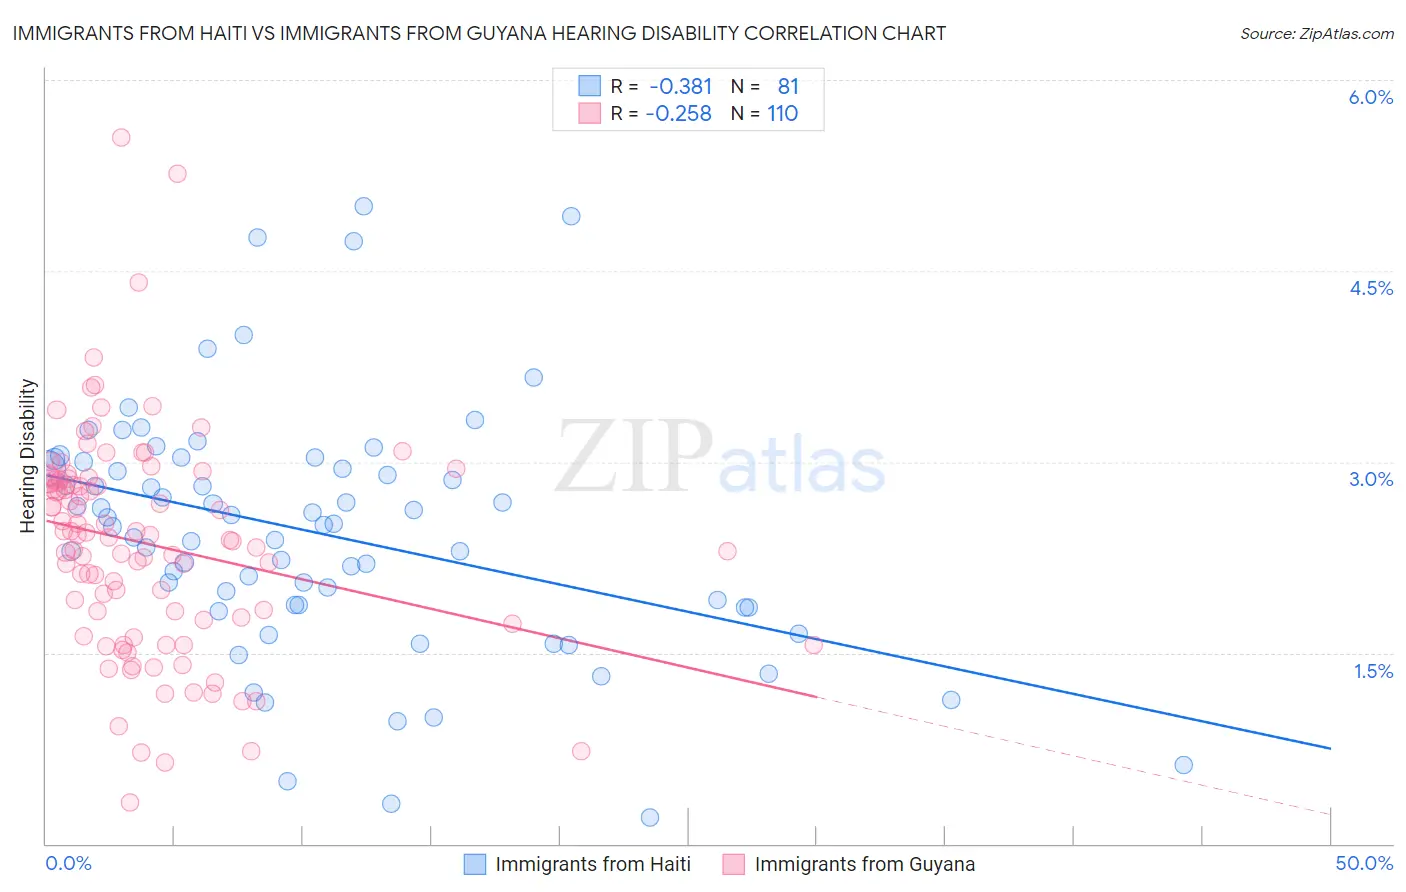
Immigrants from Haiti vs Immigrants from Guyana Hearing Disability Correlation Chart
The statistical analysis conducted on geographies consisting of 225,193,212 people shows a mild negative correlation between the proportion of Immigrants from Haiti and percentage of population with hearing disability in the United States with a correlation coefficient (R) of -0.381 and weighted average of 2.6%. Similarly, the statistical analysis conducted on geographies consisting of 183,657,050 people shows a weak negative correlation between the proportion of Immigrants from Guyana and percentage of population with hearing disability in the United States with a correlation coefficient (R) of -0.258 and weighted average of 2.3%, a difference of 11.8%.
Hearing Disability Correlation Summary
| Measurement | Immigrants from Haiti | Immigrants from Guyana |
| Minimum | 0.20% | 0.33% |
| Maximum | 5.0% | 5.6% |
| Range | 4.8% | 5.2% |
| Mean | 2.4% | 2.4% |
| Median | 2.5% | 2.4% |
| Interquartile 25% (IQ1) | 1.9% | 1.8% |
| Interquartile 75% (IQ3) | 3.0% | 2.9% |
| Interquartile Range (IQR) | 1.1% | 1.1% |
| Standard Deviation (Sample) | 0.97% | 0.87% |
| Standard Deviation (Population) | 0.96% | 0.86% |
Similar Demographics by Hearing Disability
Demographics Similar to Immigrants from Haiti by Hearing Disability
In terms of hearing disability, the demographic groups most similar to Immigrants from Haiti are Bolivian (2.6%, a difference of 0.020%), Immigrants from Caribbean (2.6%, a difference of 0.10%), Immigrants from Cameroon (2.6%, a difference of 0.11%), Immigrants from Venezuela (2.6%, a difference of 0.26%), and Immigrants from South Central Asia (2.6%, a difference of 0.37%).
| Demographics | Rating | Rank | Hearing Disability |
| Ghanaians | 99.8 /100 | #21 | Exceptional 2.5% |
| Immigrants | Sierra Leone | 99.8 /100 | #22 | Exceptional 2.6% |
| Immigrants | Nigeria | 99.8 /100 | #23 | Exceptional 2.6% |
| Immigrants | Ghana | 99.8 /100 | #24 | Exceptional 2.6% |
| Immigrants | El Salvador | 99.7 /100 | #25 | Exceptional 2.6% |
| Immigrants | Senegal | 99.7 /100 | #26 | Exceptional 2.6% |
| Immigrants | South Central Asia | 99.7 /100 | #27 | Exceptional 2.6% |
| Immigrants | Haiti | 99.7 /100 | #28 | Exceptional 2.6% |
| Bolivians | 99.7 /100 | #29 | Exceptional 2.6% |
| Immigrants | Caribbean | 99.7 /100 | #30 | Exceptional 2.6% |
| Immigrants | Cameroon | 99.7 /100 | #31 | Exceptional 2.6% |
| Immigrants | Venezuela | 99.7 /100 | #32 | Exceptional 2.6% |
| Filipinos | 99.6 /100 | #33 | Exceptional 2.6% |
| Immigrants | Pakistan | 99.6 /100 | #34 | Exceptional 2.6% |
| Salvadorans | 99.6 /100 | #35 | Exceptional 2.6% |
Demographics Similar to Immigrants from Guyana by Hearing Disability
In terms of hearing disability, the demographic groups most similar to Immigrants from Guyana are Guyanese (2.3%, a difference of 1.4%), Immigrants from Barbados (2.4%, a difference of 1.9%), Immigrants from St. Vincent and the Grenadines (2.3%, a difference of 2.8%), Vietnamese (2.4%, a difference of 3.0%), and Immigrants from Bangladesh (2.4%, a difference of 4.6%).
| Demographics | Rating | Rank | Hearing Disability |
| Immigrants | Grenada | 100.0 /100 | #1 | Exceptional 2.2% |
| Immigrants | St. Vincent and the Grenadines | 100.0 /100 | #2 | Exceptional 2.3% |
| Guyanese | 100.0 /100 | #3 | Exceptional 2.3% |
| Immigrants | Guyana | 100.0 /100 | #4 | Exceptional 2.3% |
| Immigrants | Barbados | 100.0 /100 | #5 | Exceptional 2.4% |
| Vietnamese | 100.0 /100 | #6 | Exceptional 2.4% |
| Immigrants | Bangladesh | 100.0 /100 | #7 | Exceptional 2.4% |
| British West Indians | 100.0 /100 | #8 | Exceptional 2.4% |
| Immigrants | Dominican Republic | 100.0 /100 | #9 | Exceptional 2.4% |
| Immigrants | Ecuador | 99.9 /100 | #10 | Exceptional 2.5% |
| Immigrants | Trinidad and Tobago | 99.9 /100 | #11 | Exceptional 2.5% |
| Trinidadians and Tobagonians | 99.9 /100 | #12 | Exceptional 2.5% |
| Sierra Leoneans | 99.9 /100 | #13 | Exceptional 2.5% |
| Ecuadorians | 99.9 /100 | #14 | Exceptional 2.5% |
| Barbadians | 99.9 /100 | #15 | Exceptional 2.5% |