Ukrainian vs Belgian Hearing Disability
COMPARE
Ukrainian
Belgian
Hearing Disability
Hearing Disability Comparison
Ukrainians
Belgians
3.2%
HEARING DISABILITY
2.9/ 100
METRIC RATING
232nd/ 347
METRIC RANK
3.5%
HEARING DISABILITY
0.1/ 100
METRIC RATING
266th/ 347
METRIC RANK
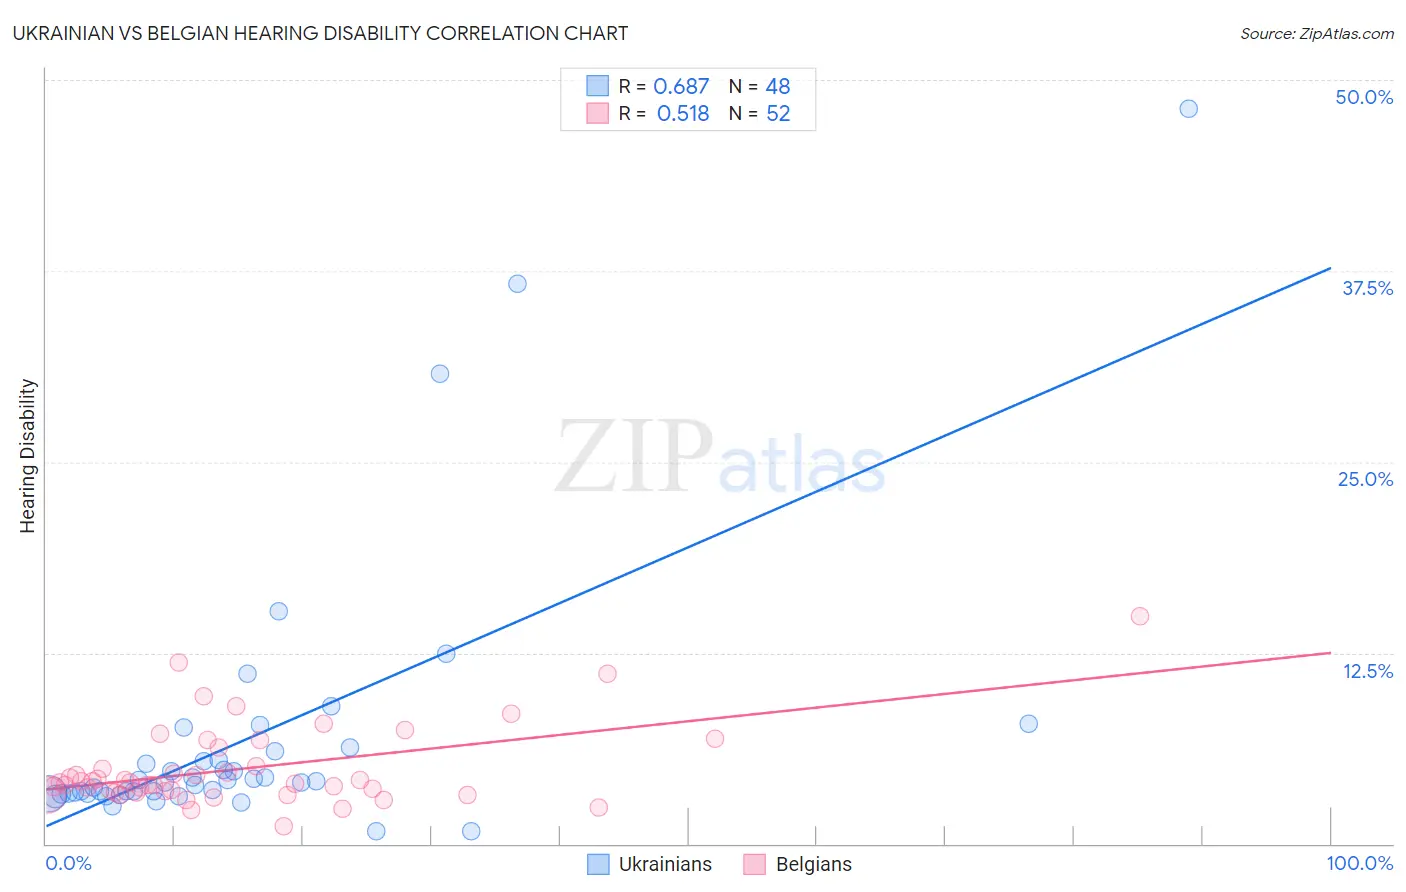
Ukrainian vs Belgian Hearing Disability Correlation Chart
The statistical analysis conducted on geographies consisting of 448,464,085 people shows a significant positive correlation between the proportion of Ukrainians and percentage of population with hearing disability in the United States with a correlation coefficient (R) of 0.687 and weighted average of 3.2%. Similarly, the statistical analysis conducted on geographies consisting of 355,952,409 people shows a substantial positive correlation between the proportion of Belgians and percentage of population with hearing disability in the United States with a correlation coefficient (R) of 0.518 and weighted average of 3.5%, a difference of 7.3%.
Hearing Disability Correlation Summary
| Measurement | Ukrainian | Belgian |
| Minimum | 0.79% | 1.1% |
| Maximum | 48.1% | 14.9% |
| Range | 47.4% | 13.8% |
| Mean | 6.9% | 4.9% |
| Median | 4.1% | 4.0% |
| Interquartile 25% (IQ1) | 3.3% | 3.4% |
| Interquartile 75% (IQ3) | 5.8% | 5.7% |
| Interquartile Range (IQR) | 2.5% | 2.3% |
| Standard Deviation (Sample) | 8.9% | 2.7% |
| Standard Deviation (Population) | 8.8% | 2.6% |
Similar Demographics by Hearing Disability
Demographics Similar to Ukrainians by Hearing Disability
In terms of hearing disability, the demographic groups most similar to Ukrainians are Luxembourger (3.2%, a difference of 0.050%), Greek (3.2%, a difference of 0.28%), Estonian (3.3%, a difference of 0.37%), Central American Indian (3.3%, a difference of 0.44%), and Guamanian/Chamorro (3.3%, a difference of 0.55%).
| Demographics | Rating | Rank | Hearing Disability |
| Latvians | 5.1 /100 | #225 | Tragic 3.2% |
| Lebanese | 5.0 /100 | #226 | Tragic 3.2% |
| Bhutanese | 4.6 /100 | #227 | Tragic 3.2% |
| Immigrants | Portugal | 4.3 /100 | #228 | Tragic 3.2% |
| Maltese | 4.1 /100 | #229 | Tragic 3.2% |
| Greeks | 3.2 /100 | #230 | Tragic 3.2% |
| Luxembourgers | 2.9 /100 | #231 | Tragic 3.2% |
| Ukrainians | 2.9 /100 | #232 | Tragic 3.2% |
| Estonians | 2.4 /100 | #233 | Tragic 3.3% |
| Central American Indians | 2.3 /100 | #234 | Tragic 3.3% |
| Guamanians/Chamorros | 2.2 /100 | #235 | Tragic 3.3% |
| Serbians | 2.2 /100 | #236 | Tragic 3.3% |
| Immigrants | Austria | 1.8 /100 | #237 | Tragic 3.3% |
| German Russians | 1.8 /100 | #238 | Tragic 3.3% |
| Nepalese | 1.2 /100 | #239 | Tragic 3.3% |
Demographics Similar to Belgians by Hearing Disability
In terms of hearing disability, the demographic groups most similar to Belgians are British (3.5%, a difference of 0.18%), Immigrants from Germany (3.5%, a difference of 0.20%), Canadian (3.5%, a difference of 0.22%), Spaniard (3.5%, a difference of 0.24%), and Immigrants from Canada (3.5%, a difference of 0.42%).
| Demographics | Rating | Rank | Hearing Disability |
| Slovenes | 0.1 /100 | #259 | Tragic 3.5% |
| Portuguese | 0.1 /100 | #260 | Tragic 3.5% |
| Hawaiians | 0.1 /100 | #261 | Tragic 3.5% |
| Immigrants | North America | 0.1 /100 | #262 | Tragic 3.5% |
| Immigrants | Canada | 0.1 /100 | #263 | Tragic 3.5% |
| Immigrants | Germany | 0.1 /100 | #264 | Tragic 3.5% |
| British | 0.1 /100 | #265 | Tragic 3.5% |
| Belgians | 0.1 /100 | #266 | Tragic 3.5% |
| Canadians | 0.1 /100 | #267 | Tragic 3.5% |
| Spaniards | 0.1 /100 | #268 | Tragic 3.5% |
| Ute | 0.1 /100 | #269 | Tragic 3.5% |
| Europeans | 0.1 /100 | #270 | Tragic 3.5% |
| Czechs | 0.1 /100 | #271 | Tragic 3.5% |
| Fijians | 0.0 /100 | #272 | Tragic 3.5% |
| Puerto Ricans | 0.0 /100 | #273 | Tragic 3.5% |