Ukrainian vs Somali Hearing Disability
COMPARE
Ukrainian
Somali
Hearing Disability
Hearing Disability Comparison
Ukrainians
Somalis
3.2%
HEARING DISABILITY
2.9/ 100
METRIC RATING
232nd/ 347
METRIC RANK
2.8%
HEARING DISABILITY
96.7/ 100
METRIC RATING
87th/ 347
METRIC RANK
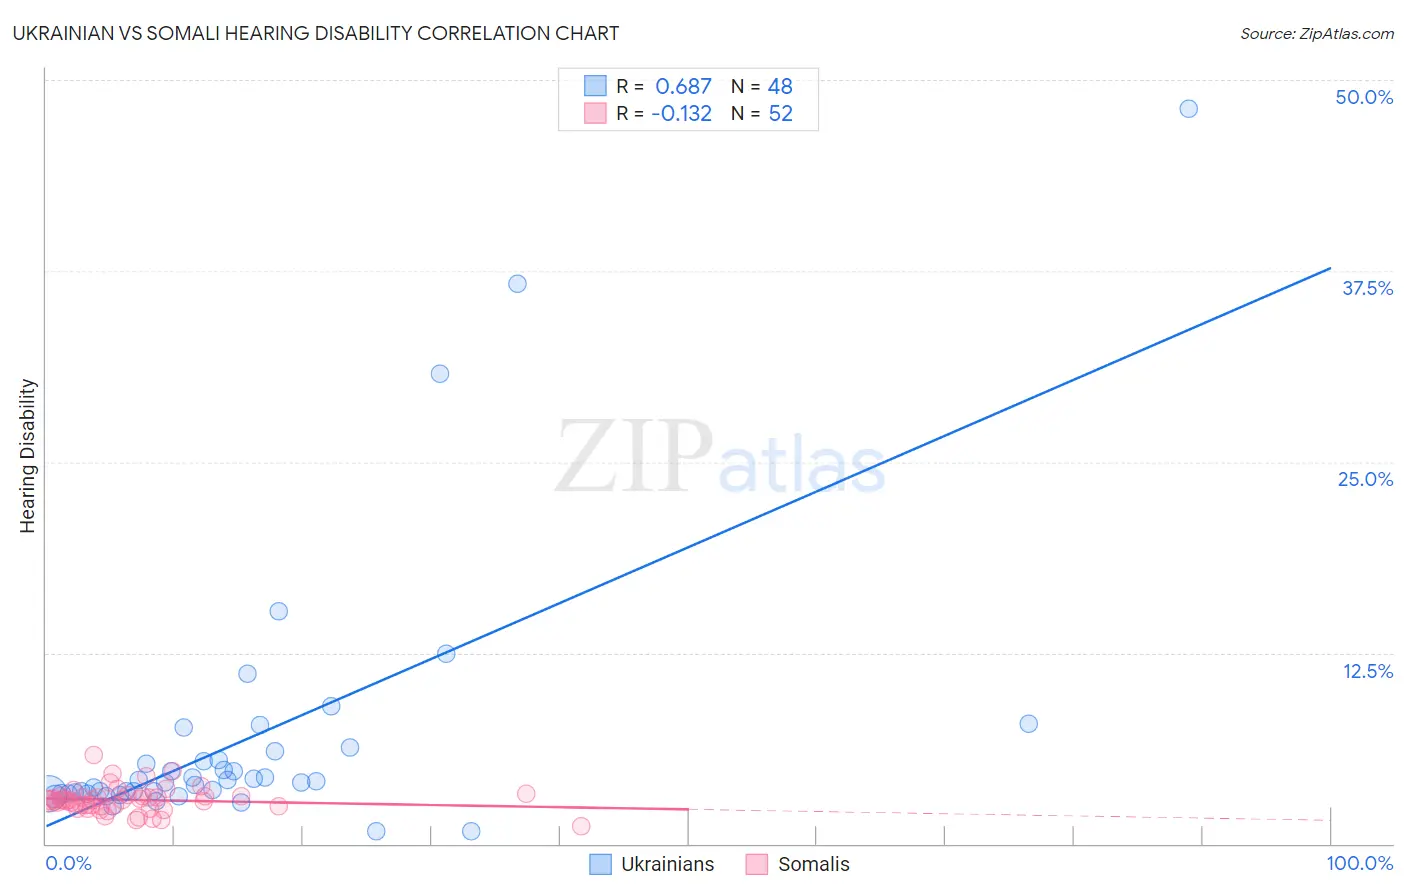
Ukrainian vs Somali Hearing Disability Correlation Chart
The statistical analysis conducted on geographies consisting of 448,464,085 people shows a significant positive correlation between the proportion of Ukrainians and percentage of population with hearing disability in the United States with a correlation coefficient (R) of 0.687 and weighted average of 3.2%. Similarly, the statistical analysis conducted on geographies consisting of 99,308,769 people shows a poor negative correlation between the proportion of Somalis and percentage of population with hearing disability in the United States with a correlation coefficient (R) of -0.132 and weighted average of 2.8%, a difference of 17.6%.
Hearing Disability Correlation Summary
| Measurement | Ukrainian | Somali |
| Minimum | 0.79% | 1.1% |
| Maximum | 48.1% | 5.8% |
| Range | 47.4% | 4.7% |
| Mean | 6.9% | 2.9% |
| Median | 4.1% | 2.9% |
| Interquartile 25% (IQ1) | 3.3% | 2.4% |
| Interquartile 75% (IQ3) | 5.8% | 3.1% |
| Interquartile Range (IQR) | 2.5% | 0.68% |
| Standard Deviation (Sample) | 8.9% | 0.83% |
| Standard Deviation (Population) | 8.8% | 0.83% |
Similar Demographics by Hearing Disability
Demographics Similar to Ukrainians by Hearing Disability
In terms of hearing disability, the demographic groups most similar to Ukrainians are Luxembourger (3.2%, a difference of 0.050%), Greek (3.2%, a difference of 0.28%), Estonian (3.3%, a difference of 0.37%), Central American Indian (3.3%, a difference of 0.44%), and Guamanian/Chamorro (3.3%, a difference of 0.55%).
| Demographics | Rating | Rank | Hearing Disability |
| Latvians | 5.1 /100 | #225 | Tragic 3.2% |
| Lebanese | 5.0 /100 | #226 | Tragic 3.2% |
| Bhutanese | 4.6 /100 | #227 | Tragic 3.2% |
| Immigrants | Portugal | 4.3 /100 | #228 | Tragic 3.2% |
| Maltese | 4.1 /100 | #229 | Tragic 3.2% |
| Greeks | 3.2 /100 | #230 | Tragic 3.2% |
| Luxembourgers | 2.9 /100 | #231 | Tragic 3.2% |
| Ukrainians | 2.9 /100 | #232 | Tragic 3.2% |
| Estonians | 2.4 /100 | #233 | Tragic 3.3% |
| Central American Indians | 2.3 /100 | #234 | Tragic 3.3% |
| Guamanians/Chamorros | 2.2 /100 | #235 | Tragic 3.3% |
| Serbians | 2.2 /100 | #236 | Tragic 3.3% |
| Immigrants | Austria | 1.8 /100 | #237 | Tragic 3.3% |
| German Russians | 1.8 /100 | #238 | Tragic 3.3% |
| Nepalese | 1.2 /100 | #239 | Tragic 3.3% |
Demographics Similar to Somalis by Hearing Disability
In terms of hearing disability, the demographic groups most similar to Somalis are Immigrants from Turkey (2.8%, a difference of 0.040%), Belizean (2.8%, a difference of 0.070%), Immigrants from Morocco (2.8%, a difference of 0.090%), Immigrants from Iran (2.8%, a difference of 0.11%), and Immigrants from Northern Africa (2.8%, a difference of 0.13%).
| Demographics | Rating | Rank | Hearing Disability |
| Immigrants | Asia | 97.2 /100 | #80 | Exceptional 2.7% |
| Immigrants | Uruguay | 97.2 /100 | #81 | Exceptional 2.7% |
| Immigrants | Armenia | 97.2 /100 | #82 | Exceptional 2.7% |
| Immigrants | Cuba | 97.2 /100 | #83 | Exceptional 2.7% |
| Immigrants | Argentina | 97.0 /100 | #84 | Exceptional 2.8% |
| Immigrants | Northern Africa | 96.9 /100 | #85 | Exceptional 2.8% |
| Immigrants | Iran | 96.8 /100 | #86 | Exceptional 2.8% |
| Somalis | 96.7 /100 | #87 | Exceptional 2.8% |
| Immigrants | Turkey | 96.7 /100 | #88 | Exceptional 2.8% |
| Belizeans | 96.6 /100 | #89 | Exceptional 2.8% |
| Immigrants | Morocco | 96.6 /100 | #90 | Exceptional 2.8% |
| Immigrants | Middle Africa | 96.5 /100 | #91 | Exceptional 2.8% |
| Iranians | 96.4 /100 | #92 | Exceptional 2.8% |
| Immigrants | Kuwait | 96.3 /100 | #93 | Exceptional 2.8% |
| Uruguayans | 95.9 /100 | #94 | Exceptional 2.8% |