Tsimshian vs Belgian Hearing Disability
COMPARE
Tsimshian
Belgian
Hearing Disability
Hearing Disability Comparison
Tsimshian
Belgians
4.7%
HEARING DISABILITY
0.0/ 100
METRIC RATING
342nd/ 347
METRIC RANK
3.5%
HEARING DISABILITY
0.1/ 100
METRIC RATING
266th/ 347
METRIC RANK
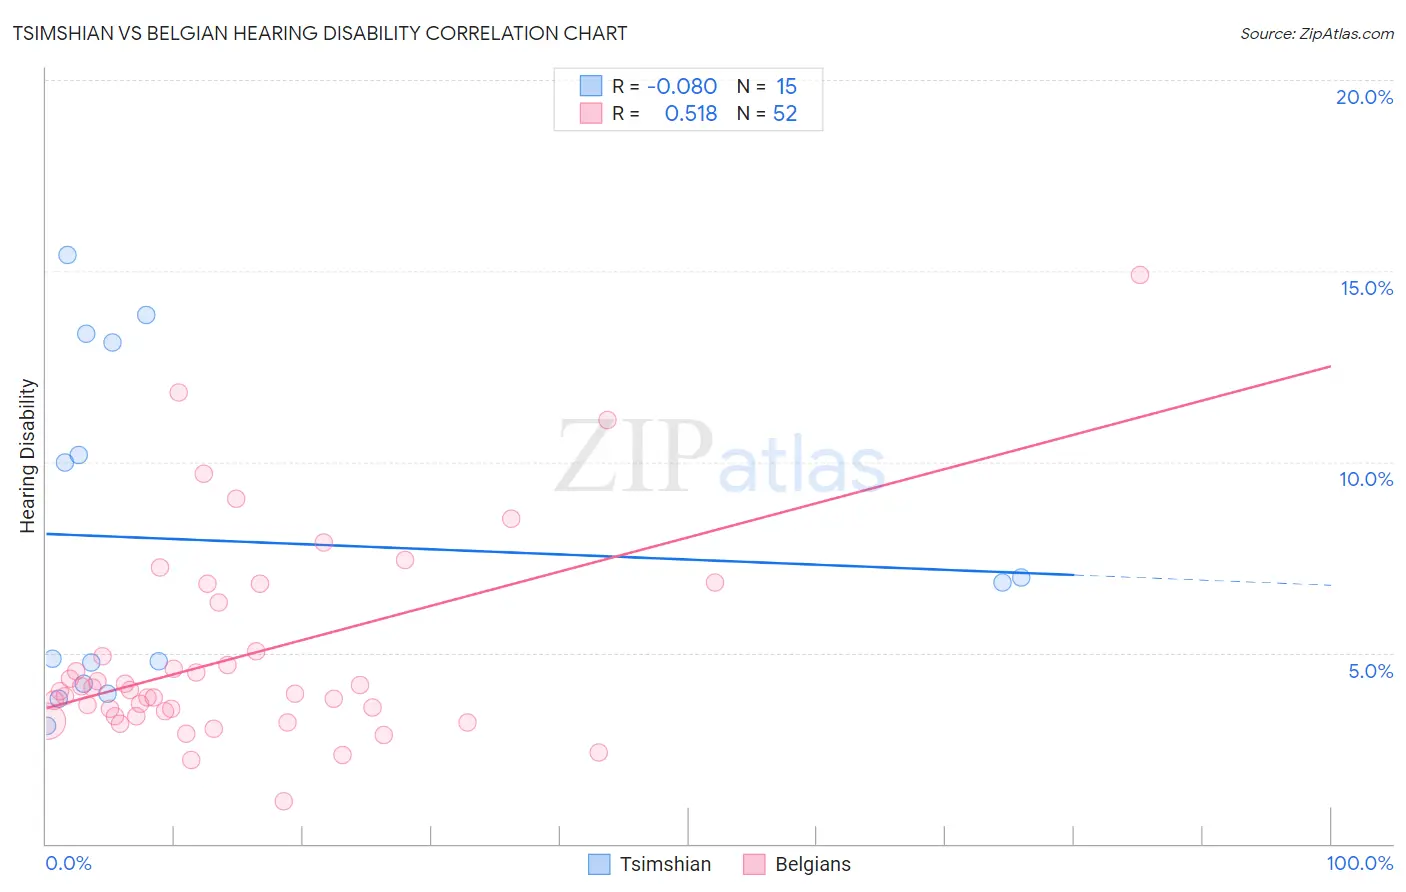
Tsimshian vs Belgian Hearing Disability Correlation Chart
The statistical analysis conducted on geographies consisting of 15,626,462 people shows a slight negative correlation between the proportion of Tsimshian and percentage of population with hearing disability in the United States with a correlation coefficient (R) of -0.080 and weighted average of 4.7%. Similarly, the statistical analysis conducted on geographies consisting of 355,952,409 people shows a substantial positive correlation between the proportion of Belgians and percentage of population with hearing disability in the United States with a correlation coefficient (R) of 0.518 and weighted average of 3.5%, a difference of 35.2%.
Hearing Disability Correlation Summary
| Measurement | Tsimshian | Belgian |
| Minimum | 3.1% | 1.1% |
| Maximum | 15.4% | 14.9% |
| Range | 12.3% | 13.8% |
| Mean | 7.9% | 4.9% |
| Median | 6.8% | 4.0% |
| Interquartile 25% (IQ1) | 4.2% | 3.4% |
| Interquartile 75% (IQ3) | 13.1% | 5.7% |
| Interquartile Range (IQR) | 8.9% | 2.3% |
| Standard Deviation (Sample) | 4.3% | 2.7% |
| Standard Deviation (Population) | 4.2% | 2.6% |
Similar Demographics by Hearing Disability
Demographics Similar to Tsimshian by Hearing Disability
In terms of hearing disability, the demographic groups most similar to Tsimshian are Inupiat (4.7%, a difference of 0.21%), Navajo (4.6%, a difference of 1.5%), Pueblo (4.6%, a difference of 1.9%), Tlingit-Haida (4.8%, a difference of 2.9%), and Choctaw (4.5%, a difference of 3.4%).
| Demographics | Rating | Rank | Hearing Disability |
| Dutch West Indians | 0.0 /100 | #333 | Tragic 4.3% |
| Aleuts | 0.0 /100 | #334 | Tragic 4.3% |
| Kiowa | 0.0 /100 | #335 | Tragic 4.3% |
| Creek | 0.0 /100 | #336 | Tragic 4.4% |
| Chickasaw | 0.0 /100 | #337 | Tragic 4.5% |
| Alaska Natives | 0.0 /100 | #338 | Tragic 4.5% |
| Choctaw | 0.0 /100 | #339 | Tragic 4.5% |
| Pueblo | 0.0 /100 | #340 | Tragic 4.6% |
| Navajo | 0.0 /100 | #341 | Tragic 4.6% |
| Tsimshian | 0.0 /100 | #342 | Tragic 4.7% |
| Inupiat | 0.0 /100 | #343 | Tragic 4.7% |
| Tlingit-Haida | 0.0 /100 | #344 | Tragic 4.8% |
| Alaskan Athabascans | 0.0 /100 | #345 | Tragic 5.3% |
| Colville | 0.0 /100 | #346 | Tragic 5.3% |
| Yup'ik | 0.0 /100 | #347 | Tragic 5.8% |
Demographics Similar to Belgians by Hearing Disability
In terms of hearing disability, the demographic groups most similar to Belgians are British (3.5%, a difference of 0.18%), Immigrants from Germany (3.5%, a difference of 0.20%), Canadian (3.5%, a difference of 0.22%), Spaniard (3.5%, a difference of 0.24%), and Immigrants from Canada (3.5%, a difference of 0.42%).
| Demographics | Rating | Rank | Hearing Disability |
| Slovenes | 0.1 /100 | #259 | Tragic 3.5% |
| Portuguese | 0.1 /100 | #260 | Tragic 3.5% |
| Hawaiians | 0.1 /100 | #261 | Tragic 3.5% |
| Immigrants | North America | 0.1 /100 | #262 | Tragic 3.5% |
| Immigrants | Canada | 0.1 /100 | #263 | Tragic 3.5% |
| Immigrants | Germany | 0.1 /100 | #264 | Tragic 3.5% |
| British | 0.1 /100 | #265 | Tragic 3.5% |
| Belgians | 0.1 /100 | #266 | Tragic 3.5% |
| Canadians | 0.1 /100 | #267 | Tragic 3.5% |
| Spaniards | 0.1 /100 | #268 | Tragic 3.5% |
| Ute | 0.1 /100 | #269 | Tragic 3.5% |
| Europeans | 0.1 /100 | #270 | Tragic 3.5% |
| Czechs | 0.1 /100 | #271 | Tragic 3.5% |
| Fijians | 0.0 /100 | #272 | Tragic 3.5% |
| Puerto Ricans | 0.0 /100 | #273 | Tragic 3.5% |