Central American Indian vs Belgian Hearing Disability
COMPARE
Central American Indian
Belgian
Hearing Disability
Hearing Disability Comparison
Central American Indians
Belgians
3.3%
HEARING DISABILITY
2.3/ 100
METRIC RATING
234th/ 347
METRIC RANK
3.5%
HEARING DISABILITY
0.1/ 100
METRIC RATING
266th/ 347
METRIC RANK
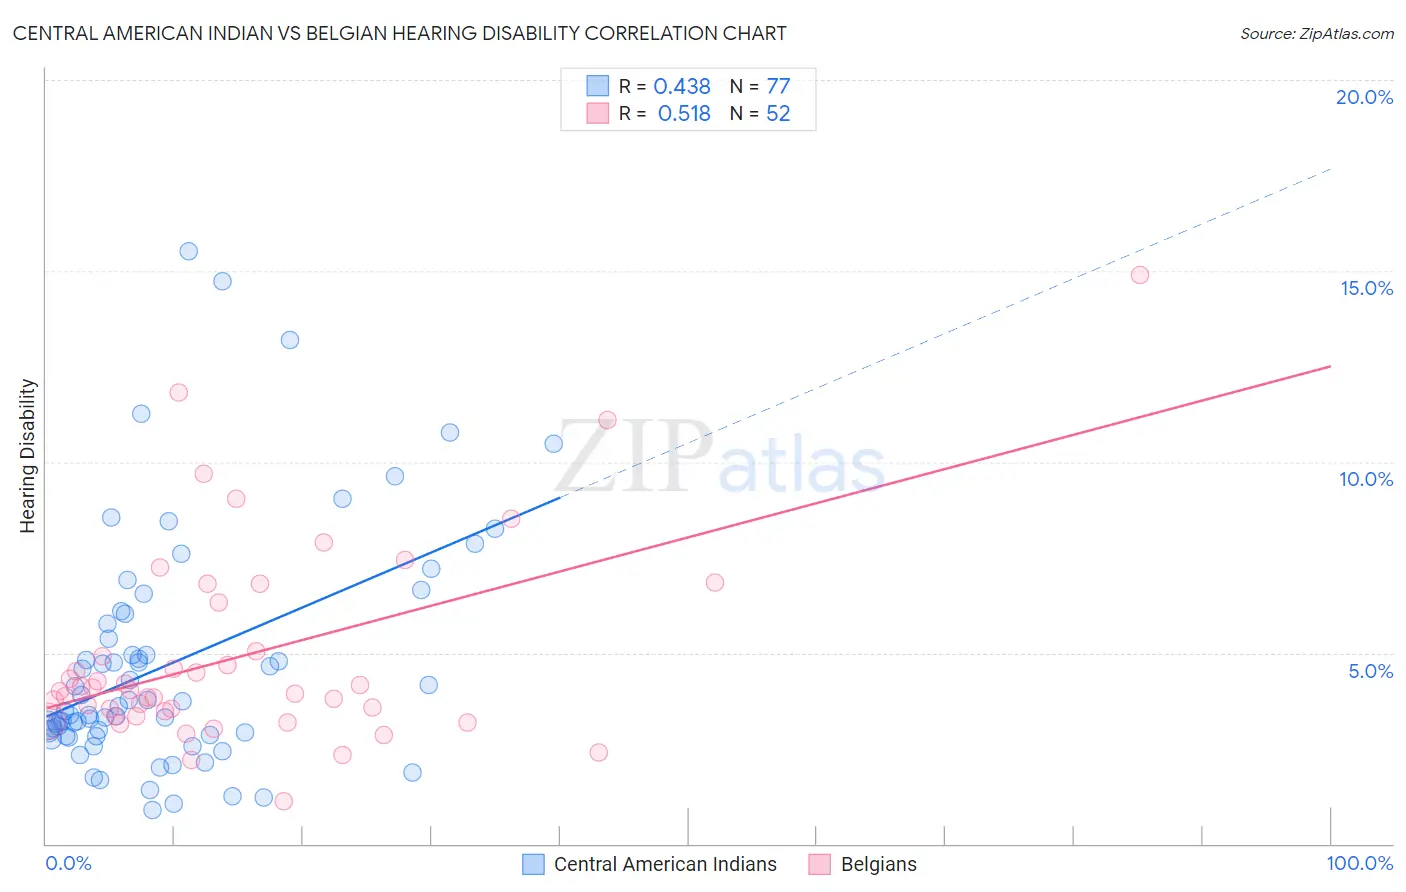
Central American Indian vs Belgian Hearing Disability Correlation Chart
The statistical analysis conducted on geographies consisting of 326,061,009 people shows a moderate positive correlation between the proportion of Central American Indians and percentage of population with hearing disability in the United States with a correlation coefficient (R) of 0.438 and weighted average of 3.3%. Similarly, the statistical analysis conducted on geographies consisting of 355,952,409 people shows a substantial positive correlation between the proportion of Belgians and percentage of population with hearing disability in the United States with a correlation coefficient (R) of 0.518 and weighted average of 3.5%, a difference of 6.9%.
Hearing Disability Correlation Summary
| Measurement | Central American Indian | Belgian |
| Minimum | 0.88% | 1.1% |
| Maximum | 15.5% | 14.9% |
| Range | 14.6% | 13.8% |
| Mean | 4.7% | 4.9% |
| Median | 3.6% | 4.0% |
| Interquartile 25% (IQ1) | 2.8% | 3.4% |
| Interquartile 75% (IQ3) | 5.9% | 5.7% |
| Interquartile Range (IQR) | 3.1% | 2.3% |
| Standard Deviation (Sample) | 3.1% | 2.7% |
| Standard Deviation (Population) | 3.1% | 2.6% |
Similar Demographics by Hearing Disability
Demographics Similar to Central American Indians by Hearing Disability
In terms of hearing disability, the demographic groups most similar to Central American Indians are Estonian (3.3%, a difference of 0.070%), Guamanian/Chamorro (3.3%, a difference of 0.10%), Serbian (3.3%, a difference of 0.17%), Ukrainian (3.2%, a difference of 0.44%), and Luxembourger (3.2%, a difference of 0.49%).
| Demographics | Rating | Rank | Hearing Disability |
| Bhutanese | 4.6 /100 | #227 | Tragic 3.2% |
| Immigrants | Portugal | 4.3 /100 | #228 | Tragic 3.2% |
| Maltese | 4.1 /100 | #229 | Tragic 3.2% |
| Greeks | 3.2 /100 | #230 | Tragic 3.2% |
| Luxembourgers | 2.9 /100 | #231 | Tragic 3.2% |
| Ukrainians | 2.9 /100 | #232 | Tragic 3.2% |
| Estonians | 2.4 /100 | #233 | Tragic 3.3% |
| Central American Indians | 2.3 /100 | #234 | Tragic 3.3% |
| Guamanians/Chamorros | 2.2 /100 | #235 | Tragic 3.3% |
| Serbians | 2.2 /100 | #236 | Tragic 3.3% |
| Immigrants | Austria | 1.8 /100 | #237 | Tragic 3.3% |
| German Russians | 1.8 /100 | #238 | Tragic 3.3% |
| Nepalese | 1.2 /100 | #239 | Tragic 3.3% |
| Immigrants | Netherlands | 1.1 /100 | #240 | Tragic 3.3% |
| Samoans | 1.1 /100 | #241 | Tragic 3.3% |
Demographics Similar to Belgians by Hearing Disability
In terms of hearing disability, the demographic groups most similar to Belgians are British (3.5%, a difference of 0.18%), Immigrants from Germany (3.5%, a difference of 0.20%), Canadian (3.5%, a difference of 0.22%), Spaniard (3.5%, a difference of 0.24%), and Immigrants from Canada (3.5%, a difference of 0.42%).
| Demographics | Rating | Rank | Hearing Disability |
| Slovenes | 0.1 /100 | #259 | Tragic 3.5% |
| Portuguese | 0.1 /100 | #260 | Tragic 3.5% |
| Hawaiians | 0.1 /100 | #261 | Tragic 3.5% |
| Immigrants | North America | 0.1 /100 | #262 | Tragic 3.5% |
| Immigrants | Canada | 0.1 /100 | #263 | Tragic 3.5% |
| Immigrants | Germany | 0.1 /100 | #264 | Tragic 3.5% |
| British | 0.1 /100 | #265 | Tragic 3.5% |
| Belgians | 0.1 /100 | #266 | Tragic 3.5% |
| Canadians | 0.1 /100 | #267 | Tragic 3.5% |
| Spaniards | 0.1 /100 | #268 | Tragic 3.5% |
| Ute | 0.1 /100 | #269 | Tragic 3.5% |
| Europeans | 0.1 /100 | #270 | Tragic 3.5% |
| Czechs | 0.1 /100 | #271 | Tragic 3.5% |
| Fijians | 0.0 /100 | #272 | Tragic 3.5% |
| Puerto Ricans | 0.0 /100 | #273 | Tragic 3.5% |