Ugandan vs Israeli Ambulatory Disability
COMPARE
Ugandan
Israeli
Ambulatory Disability
Ambulatory Disability Comparison
Ugandans
Israelis
5.7%
AMBULATORY DISABILITY
99.2/ 100
METRIC RATING
84th/ 347
METRIC RANK
5.7%
AMBULATORY DISABILITY
99.6/ 100
METRIC RATING
66th/ 347
METRIC RANK
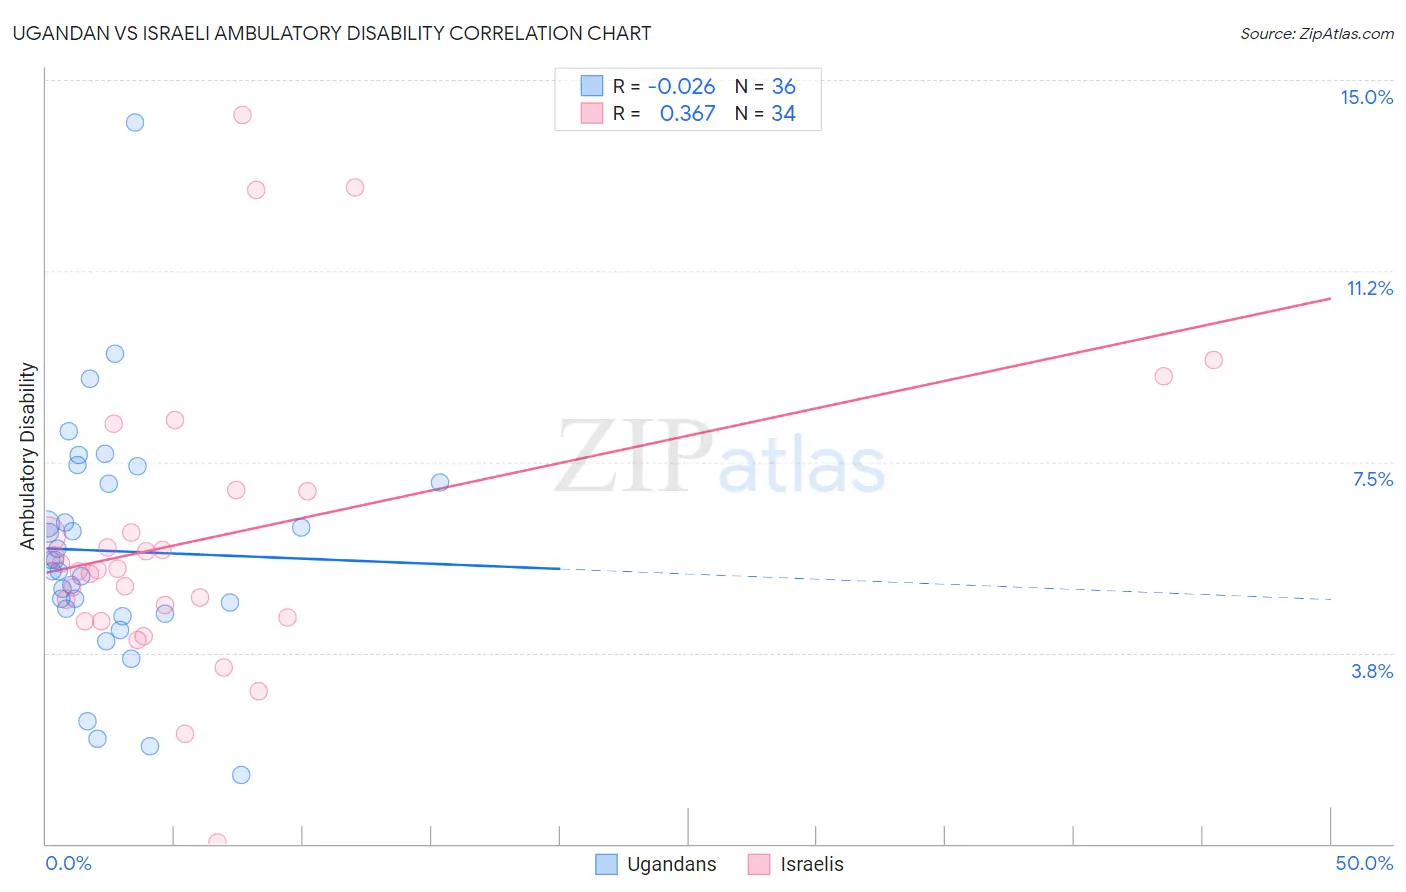
Ugandan vs Israeli Ambulatory Disability Correlation Chart
The statistical analysis conducted on geographies consisting of 94,018,396 people shows no correlation between the proportion of Ugandans and percentage of population with ambulatory disability in the United States with a correlation coefficient (R) of -0.026 and weighted average of 5.7%. Similarly, the statistical analysis conducted on geographies consisting of 211,116,012 people shows a mild positive correlation between the proportion of Israelis and percentage of population with ambulatory disability in the United States with a correlation coefficient (R) of 0.367 and weighted average of 5.7%, a difference of 1.3%.
Ambulatory Disability Correlation Summary
| Measurement | Ugandan | Israeli |
| Minimum | 1.4% | 0.023% |
| Maximum | 14.2% | 14.3% |
| Range | 12.8% | 14.3% |
| Mean | 5.7% | 6.0% |
| Median | 5.5% | 5.4% |
| Interquartile 25% (IQ1) | 4.6% | 4.4% |
| Interquartile 75% (IQ3) | 7.1% | 6.9% |
| Interquartile Range (IQR) | 2.5% | 2.5% |
| Standard Deviation (Sample) | 2.4% | 3.0% |
| Standard Deviation (Population) | 2.3% | 2.9% |
Demographics Similar to Ugandans and Israelis by Ambulatory Disability
In terms of ambulatory disability, the demographic groups most similar to Ugandans are Eastern European (5.7%, a difference of 0.0%), Palestinian (5.7%, a difference of 0.020%), Immigrants from Ireland (5.7%, a difference of 0.030%), Immigrants from Jordan (5.7%, a difference of 0.030%), and Chilean (5.7%, a difference of 0.16%). Similarly, the demographic groups most similar to Israelis are Immigrants from Uganda (5.7%, a difference of 0.010%), Sri Lankan (5.7%, a difference of 0.040%), Immigrants from Switzerland (5.7%, a difference of 0.090%), Peruvian (5.7%, a difference of 0.47%), and Sierra Leonean (5.7%, a difference of 0.71%).
| Demographics | Rating | Rank | Ambulatory Disability |
| Immigrants | Switzerland | 99.7 /100 | #65 | Exceptional 5.7% |
| Israelis | 99.6 /100 | #66 | Exceptional 5.7% |
| Immigrants | Uganda | 99.6 /100 | #67 | Exceptional 5.7% |
| Sri Lankans | 99.6 /100 | #68 | Exceptional 5.7% |
| Peruvians | 99.5 /100 | #69 | Exceptional 5.7% |
| Sierra Leoneans | 99.4 /100 | #70 | Exceptional 5.7% |
| Immigrants | Peru | 99.4 /100 | #71 | Exceptional 5.7% |
| Brazilians | 99.4 /100 | #72 | Exceptional 5.7% |
| Immigrants | Northern Africa | 99.4 /100 | #73 | Exceptional 5.7% |
| Immigrants | Cameroon | 99.4 /100 | #74 | Exceptional 5.7% |
| Immigrants | South Africa | 99.3 /100 | #75 | Exceptional 5.7% |
| Sudanese | 99.3 /100 | #76 | Exceptional 5.7% |
| Immigrants | Vietnam | 99.3 /100 | #77 | Exceptional 5.7% |
| Somalis | 99.2 /100 | #78 | Exceptional 5.7% |
| Chileans | 99.2 /100 | #79 | Exceptional 5.7% |
| Immigrants | Ireland | 99.2 /100 | #80 | Exceptional 5.7% |
| Immigrants | Jordan | 99.2 /100 | #81 | Exceptional 5.7% |
| Palestinians | 99.2 /100 | #82 | Exceptional 5.7% |
| Eastern Europeans | 99.2 /100 | #83 | Exceptional 5.7% |
| Ugandans | 99.2 /100 | #84 | Exceptional 5.7% |
| South Americans | 99.0 /100 | #85 | Exceptional 5.7% |