Ugandan vs Immigrants from Kenya Ambulatory Disability
COMPARE
Ugandan
Immigrants from Kenya
Ambulatory Disability
Ambulatory Disability Comparison
Ugandans
Immigrants from Kenya
5.7%
AMBULATORY DISABILITY
99.2/ 100
METRIC RATING
84th/ 347
METRIC RANK
5.8%
AMBULATORY DISABILITY
97.8/ 100
METRIC RATING
102nd/ 347
METRIC RANK
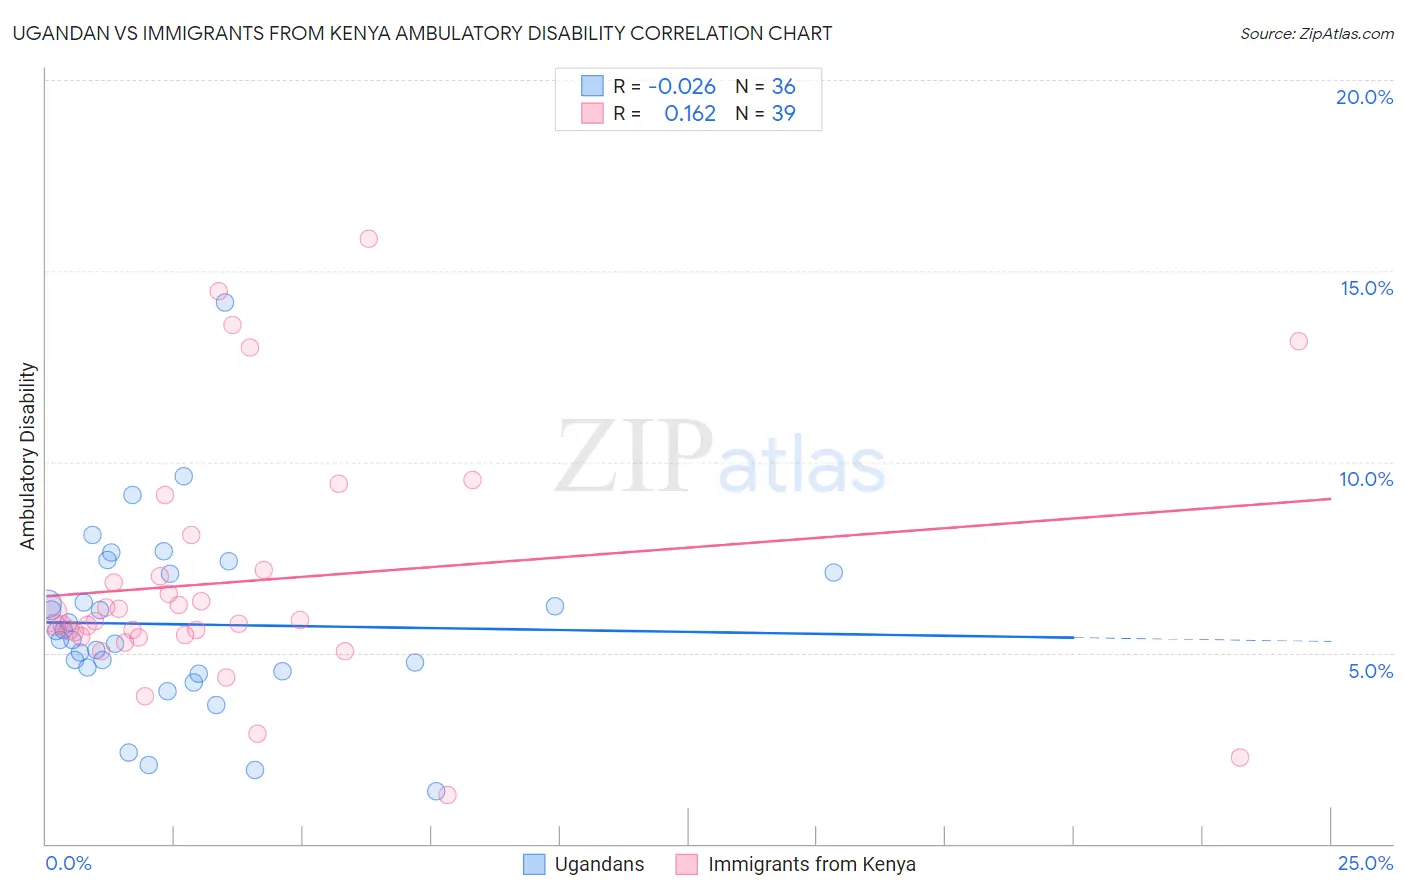
Ugandan vs Immigrants from Kenya Ambulatory Disability Correlation Chart
The statistical analysis conducted on geographies consisting of 94,018,396 people shows no correlation between the proportion of Ugandans and percentage of population with ambulatory disability in the United States with a correlation coefficient (R) of -0.026 and weighted average of 5.7%. Similarly, the statistical analysis conducted on geographies consisting of 218,037,313 people shows a poor positive correlation between the proportion of Immigrants from Kenya and percentage of population with ambulatory disability in the United States with a correlation coefficient (R) of 0.162 and weighted average of 5.8%, a difference of 1.4%.
Ambulatory Disability Correlation Summary
| Measurement | Ugandan | Immigrants from Kenya |
| Minimum | 1.4% | 1.3% |
| Maximum | 14.2% | 15.8% |
| Range | 12.8% | 14.6% |
| Mean | 5.7% | 6.9% |
| Median | 5.5% | 5.8% |
| Interquartile 25% (IQ1) | 4.6% | 5.4% |
| Interquartile 75% (IQ3) | 7.1% | 7.2% |
| Interquartile Range (IQR) | 2.5% | 1.7% |
| Standard Deviation (Sample) | 2.4% | 3.2% |
| Standard Deviation (Population) | 2.3% | 3.2% |
Demographics Similar to Ugandans and Immigrants from Kenya by Ambulatory Disability
In terms of ambulatory disability, the demographic groups most similar to Ugandans are Eastern European (5.7%, a difference of 0.0%), South American (5.7%, a difference of 0.24%), Latvian (5.7%, a difference of 0.27%), Immigrants from Chile (5.8%, a difference of 0.33%), and Soviet Union (5.8%, a difference of 0.38%). Similarly, the demographic groups most similar to Immigrants from Kenya are Immigrants from Romania (5.8%, a difference of 0.070%), Immigrants from Serbia (5.8%, a difference of 0.080%), Immigrants from South America (5.8%, a difference of 0.080%), Immigrants from Northern Europe (5.8%, a difference of 0.27%), and Immigrants from Lebanon (5.8%, a difference of 0.36%).
| Demographics | Rating | Rank | Ambulatory Disability |
| Eastern Europeans | 99.2 /100 | #83 | Exceptional 5.7% |
| Ugandans | 99.2 /100 | #84 | Exceptional 5.7% |
| South Americans | 99.0 /100 | #85 | Exceptional 5.7% |
| Latvians | 99.0 /100 | #86 | Exceptional 5.7% |
| Immigrants | Chile | 98.9 /100 | #87 | Exceptional 5.8% |
| Soviet Union | 98.9 /100 | #88 | Exceptional 5.8% |
| Bhutanese | 98.8 /100 | #89 | Exceptional 5.8% |
| Australians | 98.8 /100 | #90 | Exceptional 5.8% |
| Immigrants | Sudan | 98.8 /100 | #91 | Exceptional 5.8% |
| Immigrants | Sierra Leone | 98.6 /100 | #92 | Exceptional 5.8% |
| Immigrants | Denmark | 98.6 /100 | #93 | Exceptional 5.8% |
| Kenyans | 98.4 /100 | #94 | Exceptional 5.8% |
| Immigrants | El Salvador | 98.4 /100 | #95 | Exceptional 5.8% |
| Salvadorans | 98.4 /100 | #96 | Exceptional 5.8% |
| Immigrants | Somalia | 98.3 /100 | #97 | Exceptional 5.8% |
| Immigrants | Lebanon | 98.3 /100 | #98 | Exceptional 5.8% |
| Immigrants | Northern Europe | 98.2 /100 | #99 | Exceptional 5.8% |
| Immigrants | Serbia | 97.9 /100 | #100 | Exceptional 5.8% |
| Immigrants | South America | 97.9 /100 | #101 | Exceptional 5.8% |
| Immigrants | Kenya | 97.8 /100 | #102 | Exceptional 5.8% |
| Immigrants | Romania | 97.7 /100 | #103 | Exceptional 5.8% |