Ugandan vs White/Caucasian In Labor Force | Age 20-64
COMPARE
Ugandan
White/Caucasian
In Labor Force | Age 20-64
In Labor Force | Age 20-64 Comparison
Ugandans
Whites/Caucasians
80.6%
IN LABOR FORCE | AGE 20-64
99.8/ 100
METRIC RATING
38th/ 347
METRIC RANK
78.5%
IN LABOR FORCE | AGE 20-64
0.2/ 100
METRIC RATING
261st/ 347
METRIC RANK
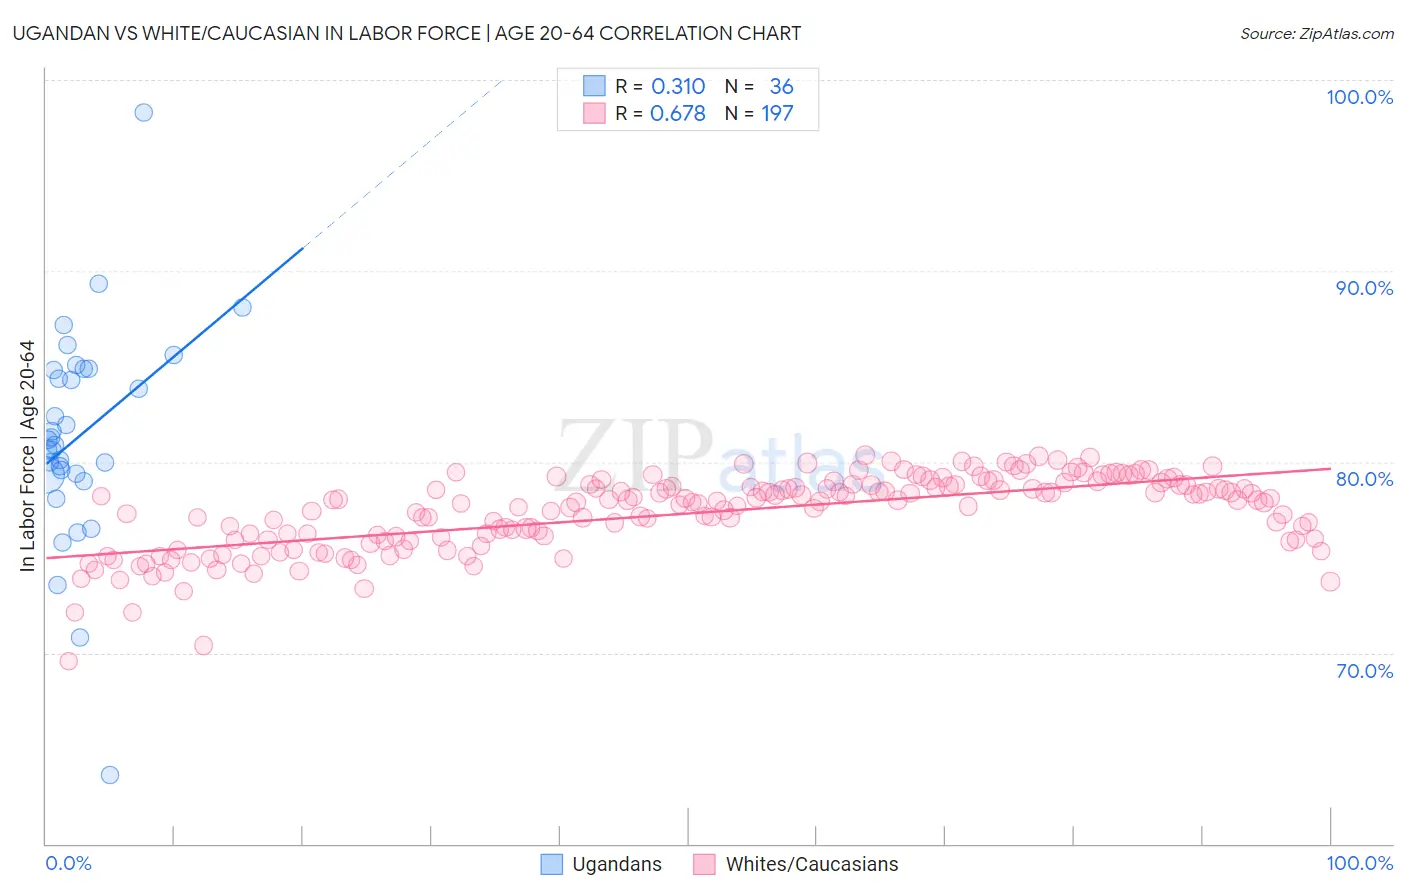
Ugandan vs White/Caucasian In Labor Force | Age 20-64 Correlation Chart
The statistical analysis conducted on geographies consisting of 94,018,069 people shows a mild positive correlation between the proportion of Ugandans and labor force participation rate among population between the ages 20 and 64 in the United States with a correlation coefficient (R) of 0.310 and weighted average of 80.6%. Similarly, the statistical analysis conducted on geographies consisting of 584,882,256 people shows a significant positive correlation between the proportion of Whites/Caucasians and labor force participation rate among population between the ages 20 and 64 in the United States with a correlation coefficient (R) of 0.678 and weighted average of 78.5%, a difference of 2.6%.
In Labor Force | Age 20-64 Correlation Summary
| Measurement | Ugandan | White/Caucasian |
| Minimum | 63.6% | 69.6% |
| Maximum | 98.3% | 80.3% |
| Range | 34.7% | 10.8% |
| Mean | 81.4% | 77.3% |
| Median | 81.0% | 77.9% |
| Interquartile 25% (IQ1) | 79.4% | 75.9% |
| Interquartile 75% (IQ3) | 84.9% | 78.8% |
| Interquartile Range (IQR) | 5.5% | 2.8% |
| Standard Deviation (Sample) | 5.7% | 2.0% |
| Standard Deviation (Population) | 5.7% | 2.0% |
Similar Demographics by In Labor Force | Age 20-64
Demographics Similar to Ugandans by In Labor Force | Age 20-64
In terms of in labor force | age 20-64, the demographic groups most similar to Ugandans are Brazilian (80.5%, a difference of 0.010%), Immigrants from Zimbabwe (80.5%, a difference of 0.010%), Paraguayan (80.6%, a difference of 0.020%), Immigrants from Moldova (80.6%, a difference of 0.020%), and Immigrants from Liberia (80.5%, a difference of 0.020%).
| Demographics | Rating | Rank | In Labor Force | Age 20-64 |
| Immigrants | Lithuania | 99.9 /100 | #31 | Exceptional 80.7% |
| Immigrants | Ireland | 99.9 /100 | #32 | Exceptional 80.7% |
| Chinese | 99.9 /100 | #33 | Exceptional 80.7% |
| Immigrants | Brazil | 99.9 /100 | #34 | Exceptional 80.7% |
| Immigrants | Poland | 99.9 /100 | #35 | Exceptional 80.6% |
| Paraguayans | 99.8 /100 | #36 | Exceptional 80.6% |
| Immigrants | Moldova | 99.8 /100 | #37 | Exceptional 80.6% |
| Ugandans | 99.8 /100 | #38 | Exceptional 80.6% |
| Brazilians | 99.8 /100 | #39 | Exceptional 80.5% |
| Immigrants | Zimbabwe | 99.8 /100 | #40 | Exceptional 80.5% |
| Immigrants | Liberia | 99.8 /100 | #41 | Exceptional 80.5% |
| Latvians | 99.8 /100 | #42 | Exceptional 80.5% |
| Czechs | 99.7 /100 | #43 | Exceptional 80.5% |
| Immigrants | Middle Africa | 99.7 /100 | #44 | Exceptional 80.5% |
| Slovenes | 99.7 /100 | #45 | Exceptional 80.5% |
Demographics Similar to Whites/Caucasians by In Labor Force | Age 20-64
In terms of in labor force | age 20-64, the demographic groups most similar to Whites/Caucasians are Immigrants from Fiji (78.6%, a difference of 0.11%), Fijian (78.4%, a difference of 0.13%), Pennsylvania German (78.4%, a difference of 0.14%), Spaniard (78.4%, a difference of 0.15%), and Tsimshian (78.7%, a difference of 0.18%).
| Demographics | Rating | Rank | In Labor Force | Age 20-64 |
| Immigrants | Lebanon | 0.5 /100 | #254 | Tragic 78.7% |
| Hawaiians | 0.5 /100 | #255 | Tragic 78.7% |
| Celtics | 0.5 /100 | #256 | Tragic 78.7% |
| Guatemalans | 0.4 /100 | #257 | Tragic 78.7% |
| Immigrants | Guatemala | 0.4 /100 | #258 | Tragic 78.7% |
| Tsimshian | 0.4 /100 | #259 | Tragic 78.7% |
| Immigrants | Fiji | 0.3 /100 | #260 | Tragic 78.6% |
| Whites/Caucasians | 0.2 /100 | #261 | Tragic 78.5% |
| Fijians | 0.1 /100 | #262 | Tragic 78.4% |
| Pennsylvania Germans | 0.1 /100 | #263 | Tragic 78.4% |
| Spaniards | 0.1 /100 | #264 | Tragic 78.4% |
| British West Indians | 0.1 /100 | #265 | Tragic 78.4% |
| Bahamians | 0.1 /100 | #266 | Tragic 78.4% |
| U.S. Virgin Islanders | 0.1 /100 | #267 | Tragic 78.4% |
| West Indians | 0.0 /100 | #268 | Tragic 78.3% |