Ugandan vs Ute Disability Age 65 to 74
COMPARE
Ugandan
Ute
Disability Age 65 to 74
Disability Age 65 to 74 Comparison
Ugandans
Ute
22.7%
DISABILITY AGE 65 TO 74
85.4/ 100
METRIC RATING
140th/ 347
METRIC RANK
27.3%
DISABILITY AGE 65 TO 74
0.0/ 100
METRIC RATING
307th/ 347
METRIC RANK
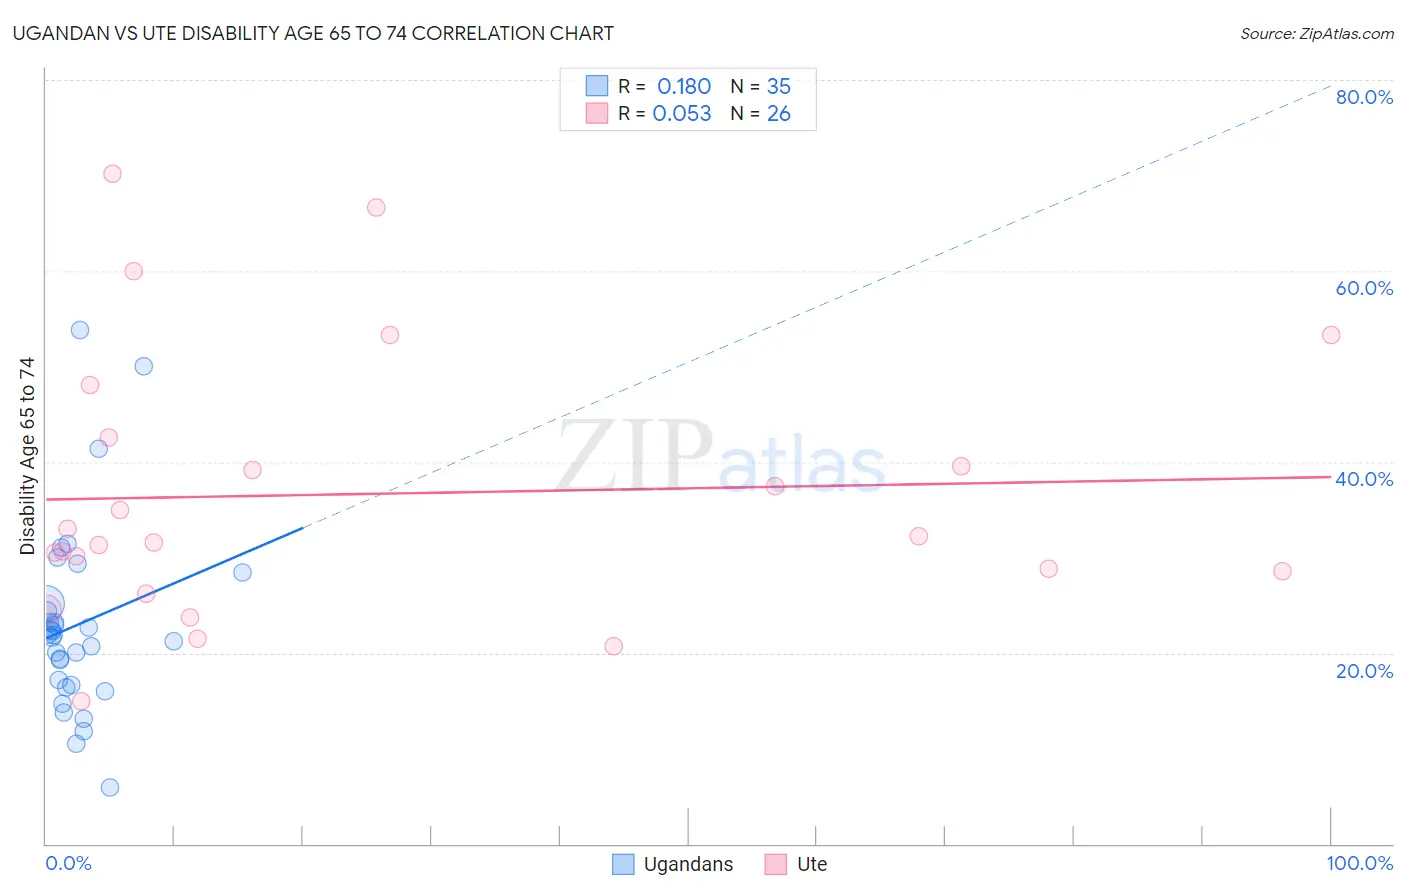
Ugandan vs Ute Disability Age 65 to 74 Correlation Chart
The statistical analysis conducted on geographies consisting of 93,935,891 people shows a poor positive correlation between the proportion of Ugandans and percentage of population with a disability between the ages 65 and 75 in the United States with a correlation coefficient (R) of 0.180 and weighted average of 22.7%. Similarly, the statistical analysis conducted on geographies consisting of 55,653,837 people shows a slight positive correlation between the proportion of Ute and percentage of population with a disability between the ages 65 and 75 in the United States with a correlation coefficient (R) of 0.053 and weighted average of 27.3%, a difference of 20.1%.
Disability Age 65 to 74 Correlation Summary
| Measurement | Ugandan | Ute |
| Minimum | 5.9% | 14.9% |
| Maximum | 53.8% | 70.2% |
| Range | 48.0% | 55.4% |
| Mean | 23.0% | 36.7% |
| Median | 21.9% | 31.9% |
| Interquartile 25% (IQ1) | 16.7% | 28.6% |
| Interquartile 75% (IQ3) | 25.1% | 42.5% |
| Interquartile Range (IQR) | 8.4% | 13.9% |
| Standard Deviation (Sample) | 9.9% | 14.2% |
| Standard Deviation (Population) | 9.8% | 13.9% |
Similar Demographics by Disability Age 65 to 74
Demographics Similar to Ugandans by Disability Age 65 to 74
In terms of disability age 65 to 74, the demographic groups most similar to Ugandans are Belgian (22.7%, a difference of 0.010%), Immigrants from Ethiopia (22.7%, a difference of 0.020%), Immigrants from Syria (22.7%, a difference of 0.040%), Arab (22.8%, a difference of 0.080%), and Danish (22.8%, a difference of 0.12%).
| Demographics | Rating | Rank | Disability Age 65 to 74 |
| Northern Europeans | 88.9 /100 | #133 | Excellent 22.6% |
| Afghans | 88.6 /100 | #134 | Excellent 22.6% |
| Immigrants | Ukraine | 88.4 /100 | #135 | Excellent 22.6% |
| Ethiopians | 87.9 /100 | #136 | Excellent 22.7% |
| Taiwanese | 87.6 /100 | #137 | Excellent 22.7% |
| Immigrants | Moldova | 87.3 /100 | #138 | Excellent 22.7% |
| Immigrants | Syria | 85.8 /100 | #139 | Excellent 22.7% |
| Ugandans | 85.4 /100 | #140 | Excellent 22.7% |
| Belgians | 85.3 /100 | #141 | Excellent 22.7% |
| Immigrants | Ethiopia | 85.3 /100 | #142 | Excellent 22.7% |
| Arabs | 84.8 /100 | #143 | Excellent 22.8% |
| Danes | 84.4 /100 | #144 | Excellent 22.8% |
| Immigrants | Uganda | 84.0 /100 | #145 | Excellent 22.8% |
| Alsatians | 83.7 /100 | #146 | Excellent 22.8% |
| Immigrants | Uzbekistan | 83.1 /100 | #147 | Excellent 22.8% |
Demographics Similar to Ute by Disability Age 65 to 74
In terms of disability age 65 to 74, the demographic groups most similar to Ute are Black/African American (27.3%, a difference of 0.060%), Sioux (27.3%, a difference of 0.15%), Yaqui (27.4%, a difference of 0.21%), Shoshone (27.4%, a difference of 0.26%), and Mexican (27.2%, a difference of 0.46%).
| Demographics | Rating | Rank | Disability Age 65 to 74 |
| Immigrants | Dominican Republic | 0.0 /100 | #300 | Tragic 27.0% |
| Immigrants | Mexico | 0.0 /100 | #301 | Tragic 27.1% |
| Central American Indians | 0.0 /100 | #302 | Tragic 27.1% |
| Tlingit-Haida | 0.0 /100 | #303 | Tragic 27.1% |
| Puget Sound Salish | 0.0 /100 | #304 | Tragic 27.2% |
| Mexicans | 0.0 /100 | #305 | Tragic 27.2% |
| Blacks/African Americans | 0.0 /100 | #306 | Tragic 27.3% |
| Ute | 0.0 /100 | #307 | Tragic 27.3% |
| Sioux | 0.0 /100 | #308 | Tragic 27.3% |
| Yaqui | 0.0 /100 | #309 | Tragic 27.4% |
| Shoshone | 0.0 /100 | #310 | Tragic 27.4% |
| Menominee | 0.0 /100 | #311 | Tragic 27.4% |
| Osage | 0.0 /100 | #312 | Tragic 27.5% |
| Paiute | 0.0 /100 | #313 | Tragic 27.8% |
| Chippewa | 0.0 /100 | #314 | Tragic 27.8% |