Immigrants from Dominican Republic vs Native Hawaiian Male Disability
COMPARE
Immigrants from Dominican Republic
Native Hawaiian
Male Disability
Male Disability Comparison
Immigrants from Dominican Republic
Native Hawaiians
11.7%
MALE DISABILITY
4.9/ 100
METRIC RATING
216th/ 347
METRIC RANK
12.5%
MALE DISABILITY
0.0/ 100
METRIC RATING
273rd/ 347
METRIC RANK
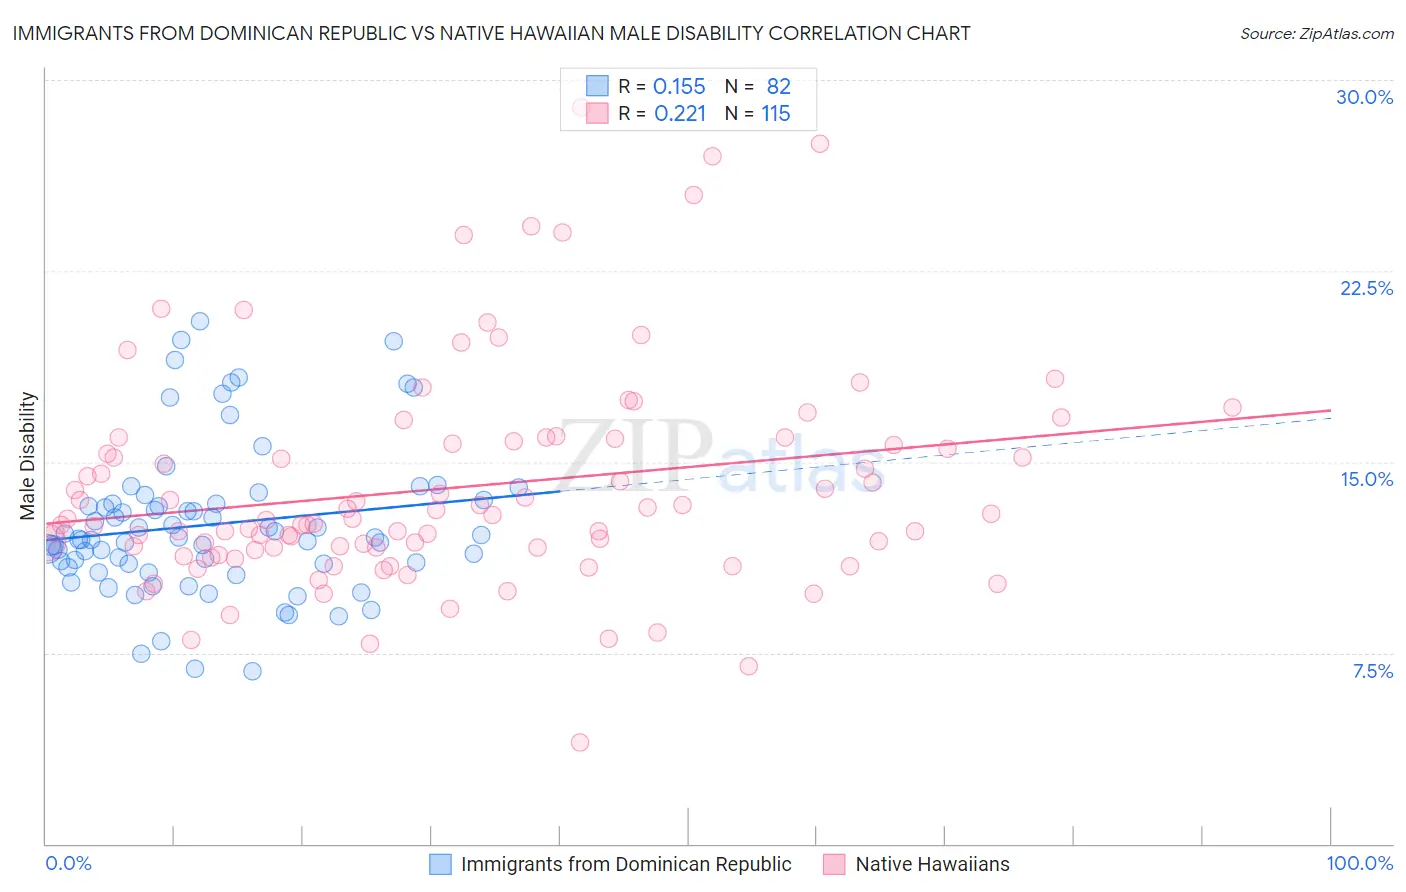
Immigrants from Dominican Republic vs Native Hawaiian Male Disability Correlation Chart
The statistical analysis conducted on geographies consisting of 275,063,348 people shows a poor positive correlation between the proportion of Immigrants from Dominican Republic and percentage of males with a disability in the United States with a correlation coefficient (R) of 0.155 and weighted average of 11.7%. Similarly, the statistical analysis conducted on geographies consisting of 332,022,677 people shows a weak positive correlation between the proportion of Native Hawaiians and percentage of males with a disability in the United States with a correlation coefficient (R) of 0.221 and weighted average of 12.5%, a difference of 6.9%.
Male Disability Correlation Summary
| Measurement | Immigrants from Dominican Republic | Native Hawaiian |
| Minimum | 6.8% | 4.0% |
| Maximum | 20.5% | 28.9% |
| Range | 13.7% | 25.0% |
| Mean | 12.5% | 14.0% |
| Median | 12.0% | 12.8% |
| Interquartile 25% (IQ1) | 11.0% | 11.6% |
| Interquartile 75% (IQ3) | 13.4% | 15.8% |
| Interquartile Range (IQR) | 2.4% | 4.2% |
| Standard Deviation (Sample) | 2.9% | 4.3% |
| Standard Deviation (Population) | 2.9% | 4.3% |
Similar Demographics by Male Disability
Demographics Similar to Immigrants from Dominican Republic by Male Disability
In terms of male disability, the demographic groups most similar to Immigrants from Dominican Republic are Immigrants from Dominica (11.7%, a difference of 0.070%), Indonesian (11.6%, a difference of 0.28%), Immigrants from England (11.7%, a difference of 0.28%), Panamanian (11.7%, a difference of 0.34%), and Immigrants from Western Europe (11.7%, a difference of 0.35%).
| Demographics | Rating | Rank | Male Disability |
| Spanish American Indians | 10.1 /100 | #209 | Poor 11.6% |
| Ute | 9.4 /100 | #210 | Tragic 11.6% |
| Immigrants | Thailand | 8.4 /100 | #211 | Tragic 11.6% |
| Immigrants | Scotland | 8.2 /100 | #212 | Tragic 11.6% |
| Mexican American Indians | 7.8 /100 | #213 | Tragic 11.6% |
| Lithuanians | 6.6 /100 | #214 | Tragic 11.6% |
| Indonesians | 5.9 /100 | #215 | Tragic 11.6% |
| Immigrants | Dominican Republic | 4.9 /100 | #216 | Tragic 11.7% |
| Immigrants | Dominica | 4.6 /100 | #217 | Tragic 11.7% |
| Immigrants | England | 4.0 /100 | #218 | Tragic 11.7% |
| Panamanians | 3.8 /100 | #219 | Tragic 11.7% |
| Immigrants | Western Europe | 3.8 /100 | #220 | Tragic 11.7% |
| Immigrants | Congo | 3.7 /100 | #221 | Tragic 11.7% |
| Alsatians | 3.3 /100 | #222 | Tragic 11.7% |
| Immigrants | Bahamas | 3.2 /100 | #223 | Tragic 11.7% |
Demographics Similar to Native Hawaiians by Male Disability
In terms of male disability, the demographic groups most similar to Native Hawaiians are Hmong (12.5%, a difference of 0.060%), Hopi (12.5%, a difference of 0.33%), Fijian (12.6%, a difference of 0.68%), African (12.6%, a difference of 0.74%), and Finnish (12.6%, a difference of 1.1%).
| Demographics | Rating | Rank | Male Disability |
| Hawaiians | 0.1 /100 | #266 | Tragic 12.3% |
| Immigrants | Germany | 0.1 /100 | #267 | Tragic 12.3% |
| Portuguese | 0.1 /100 | #268 | Tragic 12.3% |
| Czechoslovakians | 0.1 /100 | #269 | Tragic 12.3% |
| Spaniards | 0.1 /100 | #270 | Tragic 12.3% |
| Scandinavians | 0.1 /100 | #271 | Tragic 12.3% |
| Hmong | 0.0 /100 | #272 | Tragic 12.5% |
| Native Hawaiians | 0.0 /100 | #273 | Tragic 12.5% |
| Hopi | 0.0 /100 | #274 | Tragic 12.5% |
| Fijians | 0.0 /100 | #275 | Tragic 12.6% |
| Africans | 0.0 /100 | #276 | Tragic 12.6% |
| Finns | 0.0 /100 | #277 | Tragic 12.6% |
| Central American Indians | 0.0 /100 | #278 | Tragic 12.7% |
| Slovaks | 0.0 /100 | #279 | Tragic 12.7% |
| Dutch | 0.0 /100 | #280 | Tragic 12.7% |