Immigrants from Grenada vs Immigrants from Denmark Vision Disability
COMPARE
Immigrants from Grenada
Immigrants from Denmark
Vision Disability
Vision Disability Comparison
Immigrants from Grenada
Immigrants from Denmark
2.2%
VISION DISABILITY
23.1/ 100
METRIC RATING
196th/ 347
METRIC RANK
2.1%
VISION DISABILITY
92.9/ 100
METRIC RATING
112th/ 347
METRIC RANK
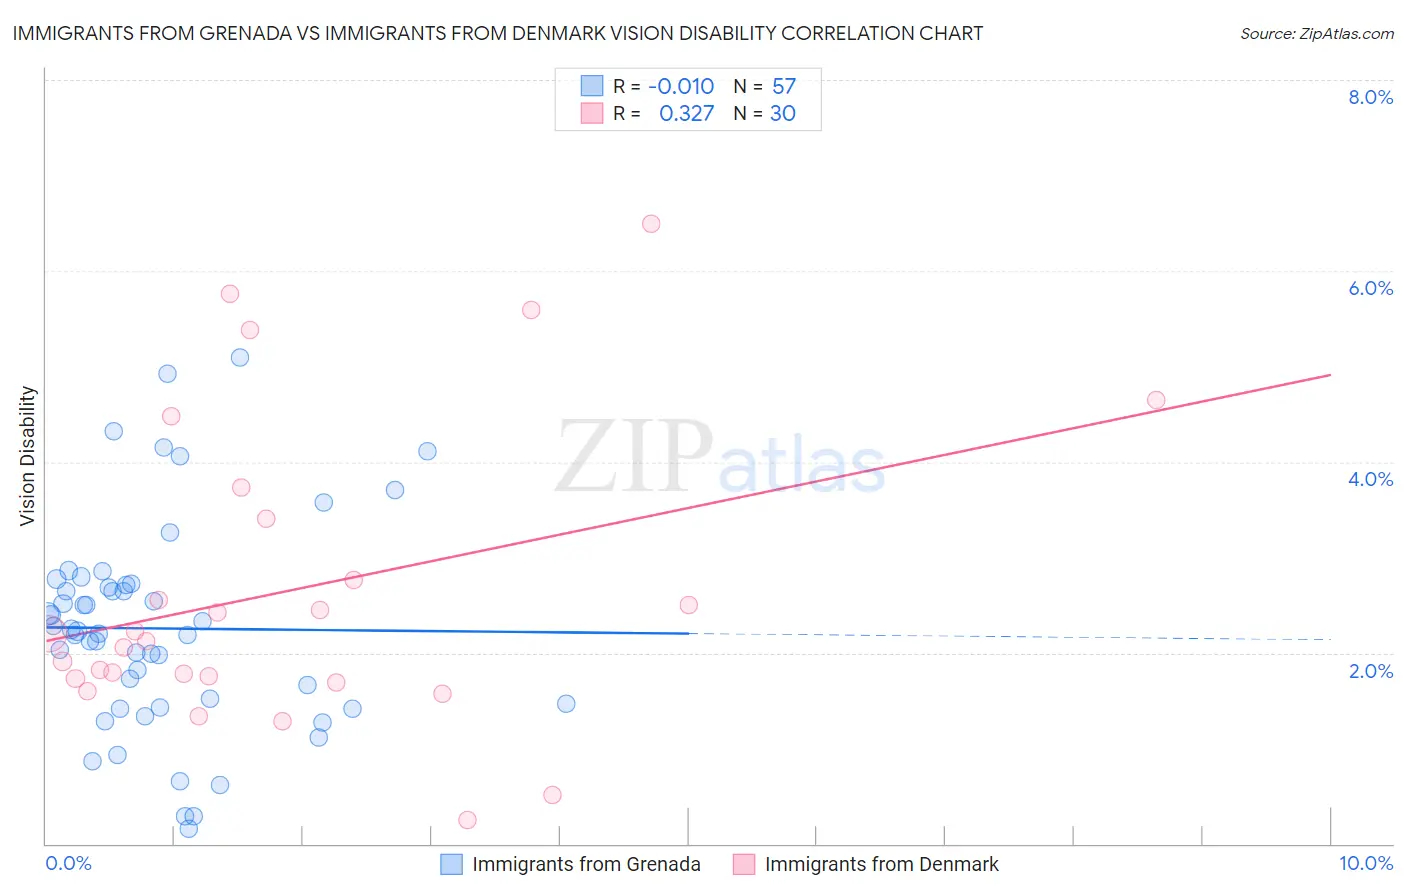
Immigrants from Grenada vs Immigrants from Denmark Vision Disability Correlation Chart
The statistical analysis conducted on geographies consisting of 67,180,438 people shows no correlation between the proportion of Immigrants from Grenada and percentage of population with vision disability in the United States with a correlation coefficient (R) of -0.010 and weighted average of 2.2%. Similarly, the statistical analysis conducted on geographies consisting of 136,398,584 people shows a mild positive correlation between the proportion of Immigrants from Denmark and percentage of population with vision disability in the United States with a correlation coefficient (R) of 0.327 and weighted average of 2.1%, a difference of 6.2%.
Vision Disability Correlation Summary
| Measurement | Immigrants from Grenada | Immigrants from Denmark |
| Minimum | 0.16% | 0.25% |
| Maximum | 5.1% | 6.5% |
| Range | 4.9% | 6.2% |
| Mean | 2.3% | 2.7% |
| Median | 2.2% | 2.2% |
| Interquartile 25% (IQ1) | 1.4% | 1.7% |
| Interquartile 75% (IQ3) | 2.7% | 3.4% |
| Interquartile Range (IQR) | 1.3% | 1.7% |
| Standard Deviation (Sample) | 1.1% | 1.6% |
| Standard Deviation (Population) | 1.1% | 1.6% |
Similar Demographics by Vision Disability
Demographics Similar to Immigrants from Grenada by Vision Disability
In terms of vision disability, the demographic groups most similar to Immigrants from Grenada are Immigrants (2.2%, a difference of 0.050%), Immigrants from Barbados (2.2%, a difference of 0.070%), Ghanaian (2.2%, a difference of 0.11%), Czechoslovakian (2.2%, a difference of 0.13%), and British (2.2%, a difference of 0.17%).
| Demographics | Rating | Rank | Vision Disability |
| Salvadorans | 27.4 /100 | #189 | Fair 2.2% |
| Immigrants | Costa Rica | 26.1 /100 | #190 | Fair 2.2% |
| Canadians | 25.8 /100 | #191 | Fair 2.2% |
| Europeans | 25.7 /100 | #192 | Fair 2.2% |
| British | 25.1 /100 | #193 | Fair 2.2% |
| Immigrants | Barbados | 24.0 /100 | #194 | Fair 2.2% |
| Immigrants | Immigrants | 23.7 /100 | #195 | Fair 2.2% |
| Immigrants | Grenada | 23.1 /100 | #196 | Fair 2.2% |
| Ghanaians | 21.8 /100 | #197 | Fair 2.2% |
| Czechoslovakians | 21.6 /100 | #198 | Fair 2.2% |
| Immigrants | El Salvador | 21.0 /100 | #199 | Fair 2.2% |
| Immigrants | Thailand | 20.1 /100 | #200 | Fair 2.2% |
| Slovaks | 18.8 /100 | #201 | Poor 2.2% |
| Immigrants | Zaire | 18.0 /100 | #202 | Poor 2.2% |
| Dutch | 17.1 /100 | #203 | Poor 2.2% |
Demographics Similar to Immigrants from Denmark by Vision Disability
In terms of vision disability, the demographic groups most similar to Immigrants from Denmark are Kenyan (2.1%, a difference of 0.12%), Croatian (2.1%, a difference of 0.15%), Peruvian (2.1%, a difference of 0.16%), Immigrants from Vietnam (2.1%, a difference of 0.18%), and Ugandan (2.1%, a difference of 0.18%).
| Demographics | Rating | Rank | Vision Disability |
| Carpatho Rusyns | 94.3 /100 | #105 | Exceptional 2.1% |
| Swedes | 94.2 /100 | #106 | Exceptional 2.1% |
| Danes | 94.2 /100 | #107 | Exceptional 2.1% |
| Koreans | 94.1 /100 | #108 | Exceptional 2.1% |
| Chileans | 94.0 /100 | #109 | Exceptional 2.1% |
| Immigrants | Armenia | 93.8 /100 | #110 | Exceptional 2.1% |
| Peruvians | 93.5 /100 | #111 | Exceptional 2.1% |
| Immigrants | Denmark | 92.9 /100 | #112 | Exceptional 2.1% |
| Kenyans | 92.5 /100 | #113 | Exceptional 2.1% |
| Croatians | 92.3 /100 | #114 | Exceptional 2.1% |
| Immigrants | Vietnam | 92.2 /100 | #115 | Exceptional 2.1% |
| Ugandans | 92.2 /100 | #116 | Exceptional 2.1% |
| Poles | 92.0 /100 | #117 | Exceptional 2.1% |
| Immigrants | Philippines | 91.4 /100 | #118 | Exceptional 2.1% |
| Immigrants | Uganda | 91.4 /100 | #119 | Exceptional 2.1% |