Turkish vs Palestinian Vision Disability
COMPARE
Turkish
Palestinian
Vision Disability
Vision Disability Comparison
Turks
Palestinians
1.9%
VISION DISABILITY
100.0/ 100
METRIC RATING
21st/ 347
METRIC RANK
2.0%
VISION DISABILITY
98.3/ 100
METRIC RATING
74th/ 347
METRIC RANK
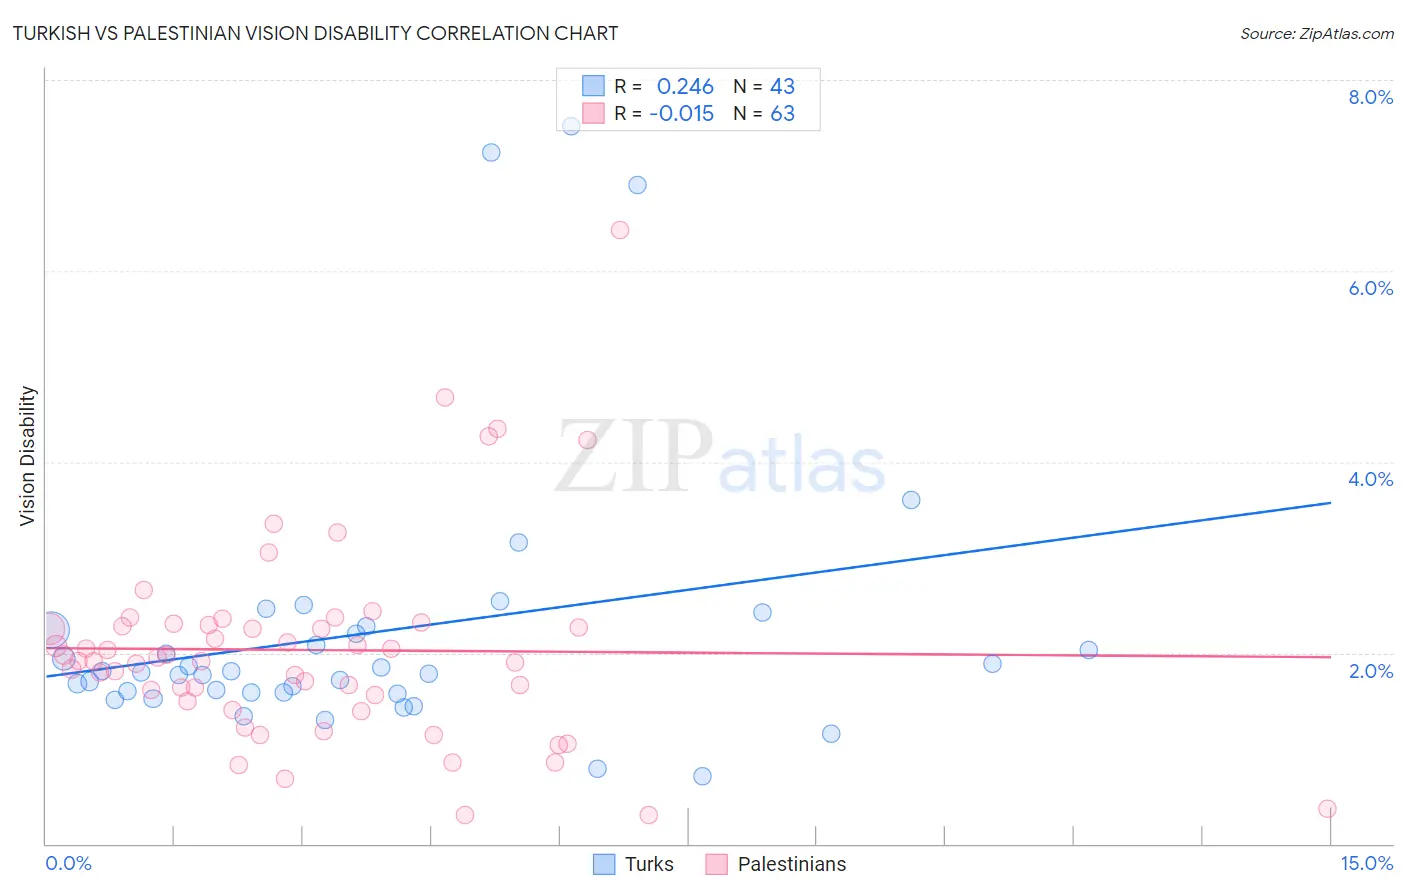
Turkish vs Palestinian Vision Disability Correlation Chart
The statistical analysis conducted on geographies consisting of 271,748,480 people shows a weak positive correlation between the proportion of Turks and percentage of population with vision disability in the United States with a correlation coefficient (R) of 0.246 and weighted average of 1.9%. Similarly, the statistical analysis conducted on geographies consisting of 216,427,848 people shows no correlation between the proportion of Palestinians and percentage of population with vision disability in the United States with a correlation coefficient (R) of -0.015 and weighted average of 2.0%, a difference of 6.4%.
Vision Disability Correlation Summary
| Measurement | Turkish | Palestinian |
| Minimum | 0.70% | 0.30% |
| Maximum | 7.5% | 6.4% |
| Range | 6.8% | 6.1% |
| Mean | 2.2% | 2.0% |
| Median | 1.8% | 1.9% |
| Interquartile 25% (IQ1) | 1.6% | 1.5% |
| Interquartile 75% (IQ3) | 2.2% | 2.3% |
| Interquartile Range (IQR) | 0.65% | 0.81% |
| Standard Deviation (Sample) | 1.5% | 1.1% |
| Standard Deviation (Population) | 1.5% | 1.1% |
Similar Demographics by Vision Disability
Demographics Similar to Turks by Vision Disability
In terms of vision disability, the demographic groups most similar to Turks are Immigrants from Pakistan (1.9%, a difference of 0.050%), Asian (1.9%, a difference of 0.31%), Immigrants from Asia (1.9%, a difference of 0.59%), Immigrants from Lithuania (1.9%, a difference of 0.71%), and Bulgarian (1.9%, a difference of 0.75%).
| Demographics | Rating | Rank | Vision Disability |
| Immigrants | China | 100.0 /100 | #14 | Exceptional 1.8% |
| Immigrants | Bolivia | 100.0 /100 | #15 | Exceptional 1.8% |
| Indians (Asian) | 100.0 /100 | #16 | Exceptional 1.8% |
| Burmese | 100.0 /100 | #17 | Exceptional 1.8% |
| Bolivians | 100.0 /100 | #18 | Exceptional 1.9% |
| Immigrants | Sri Lanka | 100.0 /100 | #19 | Exceptional 1.9% |
| Asians | 100.0 /100 | #20 | Exceptional 1.9% |
| Turks | 100.0 /100 | #21 | Exceptional 1.9% |
| Immigrants | Pakistan | 100.0 /100 | #22 | Exceptional 1.9% |
| Immigrants | Asia | 99.9 /100 | #23 | Exceptional 1.9% |
| Immigrants | Lithuania | 99.9 /100 | #24 | Exceptional 1.9% |
| Bulgarians | 99.9 /100 | #25 | Exceptional 1.9% |
| Immigrants | Japan | 99.9 /100 | #26 | Exceptional 1.9% |
| Taiwanese | 99.9 /100 | #27 | Exceptional 1.9% |
| Immigrants | Malaysia | 99.9 /100 | #28 | Exceptional 1.9% |
Demographics Similar to Palestinians by Vision Disability
In terms of vision disability, the demographic groups most similar to Palestinians are Immigrants from North Macedonia (2.0%, a difference of 0.0%), Paraguayan (2.0%, a difference of 0.020%), Immigrants from Jordan (2.0%, a difference of 0.020%), Immigrants from Eritrea (2.0%, a difference of 0.050%), and Immigrants from Eastern Europe (2.0%, a difference of 0.050%).
| Demographics | Rating | Rank | Vision Disability |
| Immigrants | Northern Africa | 98.8 /100 | #67 | Exceptional 2.0% |
| Immigrants | Czechoslovakia | 98.7 /100 | #68 | Exceptional 2.0% |
| Russians | 98.6 /100 | #69 | Exceptional 2.0% |
| Immigrants | Kazakhstan | 98.6 /100 | #70 | Exceptional 2.0% |
| Immigrants | Northern Europe | 98.6 /100 | #71 | Exceptional 2.0% |
| Immigrants | France | 98.5 /100 | #72 | Exceptional 2.0% |
| Immigrants | Eritrea | 98.4 /100 | #73 | Exceptional 2.0% |
| Palestinians | 98.3 /100 | #74 | Exceptional 2.0% |
| Immigrants | North Macedonia | 98.3 /100 | #75 | Exceptional 2.0% |
| Paraguayans | 98.3 /100 | #76 | Exceptional 2.0% |
| Immigrants | Jordan | 98.3 /100 | #77 | Exceptional 2.0% |
| Immigrants | Eastern Europe | 98.3 /100 | #78 | Exceptional 2.0% |
| Assyrians/Chaldeans/Syriacs | 98.1 /100 | #79 | Exceptional 2.0% |
| Lithuanians | 97.7 /100 | #80 | Exceptional 2.0% |
| Soviet Union | 97.6 /100 | #81 | Exceptional 2.0% |