Immigrants from Norway vs Immigrants from Denmark Vision Disability
COMPARE
Immigrants from Norway
Immigrants from Denmark
Vision Disability
Vision Disability Comparison
Immigrants from Norway
Immigrants from Denmark
2.1%
VISION DISABILITY
75.5/ 100
METRIC RATING
151st/ 347
METRIC RANK
2.1%
VISION DISABILITY
92.9/ 100
METRIC RATING
112th/ 347
METRIC RANK
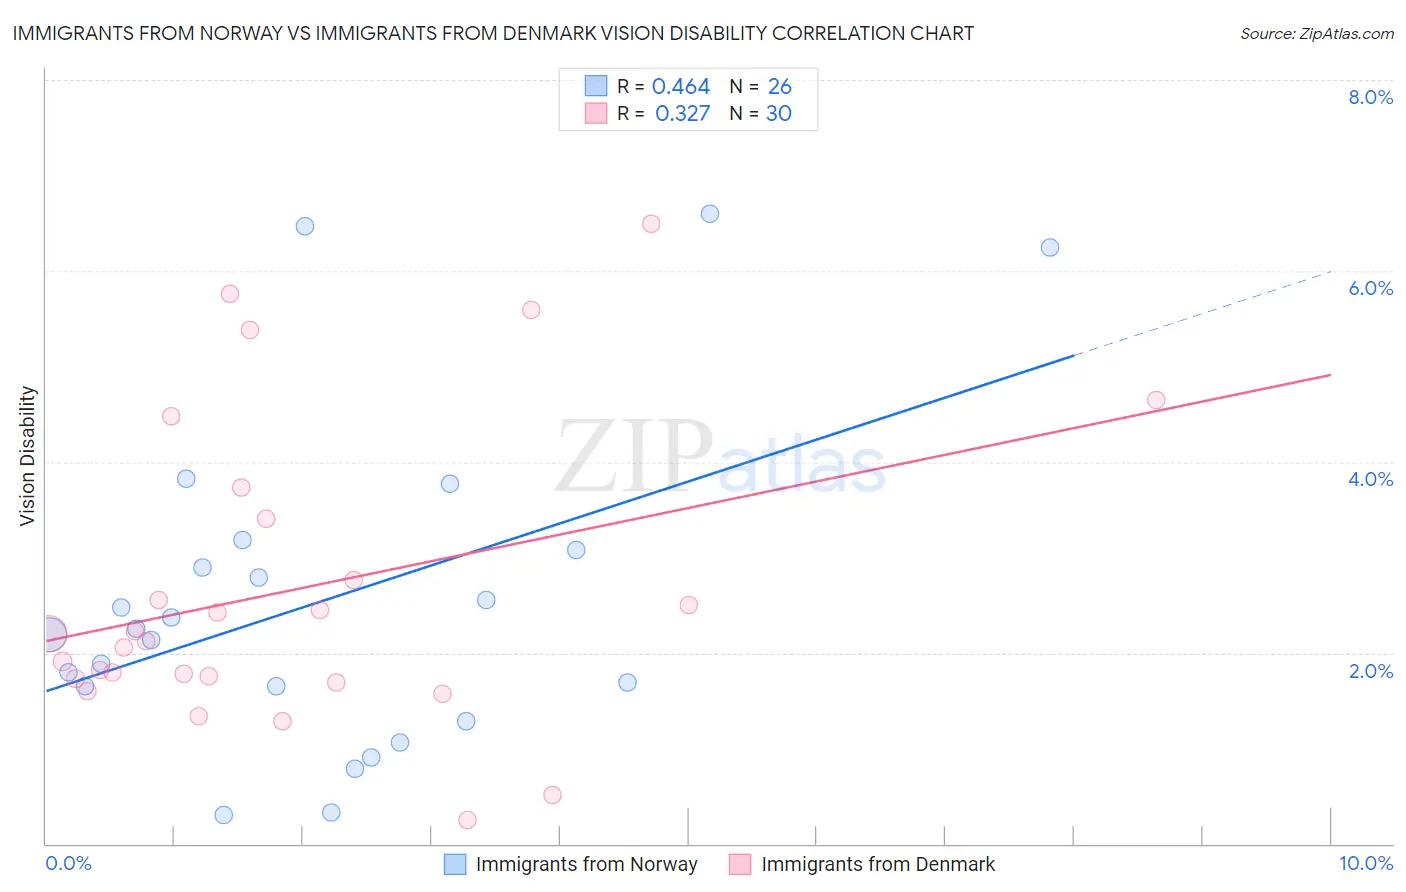
Immigrants from Norway vs Immigrants from Denmark Vision Disability Correlation Chart
The statistical analysis conducted on geographies consisting of 116,669,624 people shows a moderate positive correlation between the proportion of Immigrants from Norway and percentage of population with vision disability in the United States with a correlation coefficient (R) of 0.464 and weighted average of 2.1%. Similarly, the statistical analysis conducted on geographies consisting of 136,398,584 people shows a mild positive correlation between the proportion of Immigrants from Denmark and percentage of population with vision disability in the United States with a correlation coefficient (R) of 0.327 and weighted average of 2.1%, a difference of 2.4%.
Vision Disability Correlation Summary
| Measurement | Immigrants from Norway | Immigrants from Denmark |
| Minimum | 0.30% | 0.25% |
| Maximum | 6.6% | 6.5% |
| Range | 6.3% | 6.2% |
| Mean | 2.5% | 2.7% |
| Median | 2.2% | 2.2% |
| Interquartile 25% (IQ1) | 1.6% | 1.7% |
| Interquartile 75% (IQ3) | 3.1% | 3.4% |
| Interquartile Range (IQR) | 1.4% | 1.7% |
| Standard Deviation (Sample) | 1.7% | 1.6% |
| Standard Deviation (Population) | 1.7% | 1.6% |
Similar Demographics by Vision Disability
Demographics Similar to Immigrants from Norway by Vision Disability
In terms of vision disability, the demographic groups most similar to Immigrants from Norway are Belgian (2.1%, a difference of 0.040%), Colombian (2.1%, a difference of 0.070%), Immigrants from Southern Europe (2.1%, a difference of 0.080%), Immigrants from South America (2.1%, a difference of 0.15%), and Slovene (2.1%, a difference of 0.16%).
| Demographics | Rating | Rank | Vision Disability |
| Ukrainians | 81.9 /100 | #144 | Excellent 2.1% |
| Immigrants | Bosnia and Herzegovina | 81.5 /100 | #145 | Excellent 2.1% |
| Italians | 79.7 /100 | #146 | Good 2.1% |
| Immigrants | Sudan | 78.4 /100 | #147 | Good 2.1% |
| Finns | 78.3 /100 | #148 | Good 2.1% |
| Colombians | 76.2 /100 | #149 | Good 2.1% |
| Belgians | 75.9 /100 | #150 | Good 2.1% |
| Immigrants | Norway | 75.5 /100 | #151 | Good 2.1% |
| Immigrants | Southern Europe | 74.6 /100 | #152 | Good 2.1% |
| Immigrants | South America | 73.8 /100 | #153 | Good 2.1% |
| Slovenes | 73.6 /100 | #154 | Good 2.1% |
| Immigrants | Colombia | 72.1 /100 | #155 | Good 2.1% |
| Pakistanis | 71.6 /100 | #156 | Good 2.1% |
| Serbians | 70.2 /100 | #157 | Good 2.1% |
| Immigrants | Uzbekistan | 69.9 /100 | #158 | Good 2.1% |
Demographics Similar to Immigrants from Denmark by Vision Disability
In terms of vision disability, the demographic groups most similar to Immigrants from Denmark are Kenyan (2.1%, a difference of 0.12%), Croatian (2.1%, a difference of 0.15%), Peruvian (2.1%, a difference of 0.16%), Immigrants from Vietnam (2.1%, a difference of 0.18%), and Ugandan (2.1%, a difference of 0.18%).
| Demographics | Rating | Rank | Vision Disability |
| Carpatho Rusyns | 94.3 /100 | #105 | Exceptional 2.1% |
| Swedes | 94.2 /100 | #106 | Exceptional 2.1% |
| Danes | 94.2 /100 | #107 | Exceptional 2.1% |
| Koreans | 94.1 /100 | #108 | Exceptional 2.1% |
| Chileans | 94.0 /100 | #109 | Exceptional 2.1% |
| Immigrants | Armenia | 93.8 /100 | #110 | Exceptional 2.1% |
| Peruvians | 93.5 /100 | #111 | Exceptional 2.1% |
| Immigrants | Denmark | 92.9 /100 | #112 | Exceptional 2.1% |
| Kenyans | 92.5 /100 | #113 | Exceptional 2.1% |
| Croatians | 92.3 /100 | #114 | Exceptional 2.1% |
| Immigrants | Vietnam | 92.2 /100 | #115 | Exceptional 2.1% |
| Ugandans | 92.2 /100 | #116 | Exceptional 2.1% |
| Poles | 92.0 /100 | #117 | Exceptional 2.1% |
| Immigrants | Philippines | 91.4 /100 | #118 | Exceptional 2.1% |
| Immigrants | Uganda | 91.4 /100 | #119 | Exceptional 2.1% |