Turkish vs Okinawan Disability Age Under 5
COMPARE
Turkish
Okinawan
Disability Age Under 5
Disability Age Under 5 Comparison
Turks
Okinawans
1.1%
DISABILITY AGE UNDER 5
98.0/ 100
METRIC RATING
81st/ 347
METRIC RANK
1.1%
DISABILITY AGE UNDER 5
97.6/ 100
METRIC RATING
86th/ 347
METRIC RANK
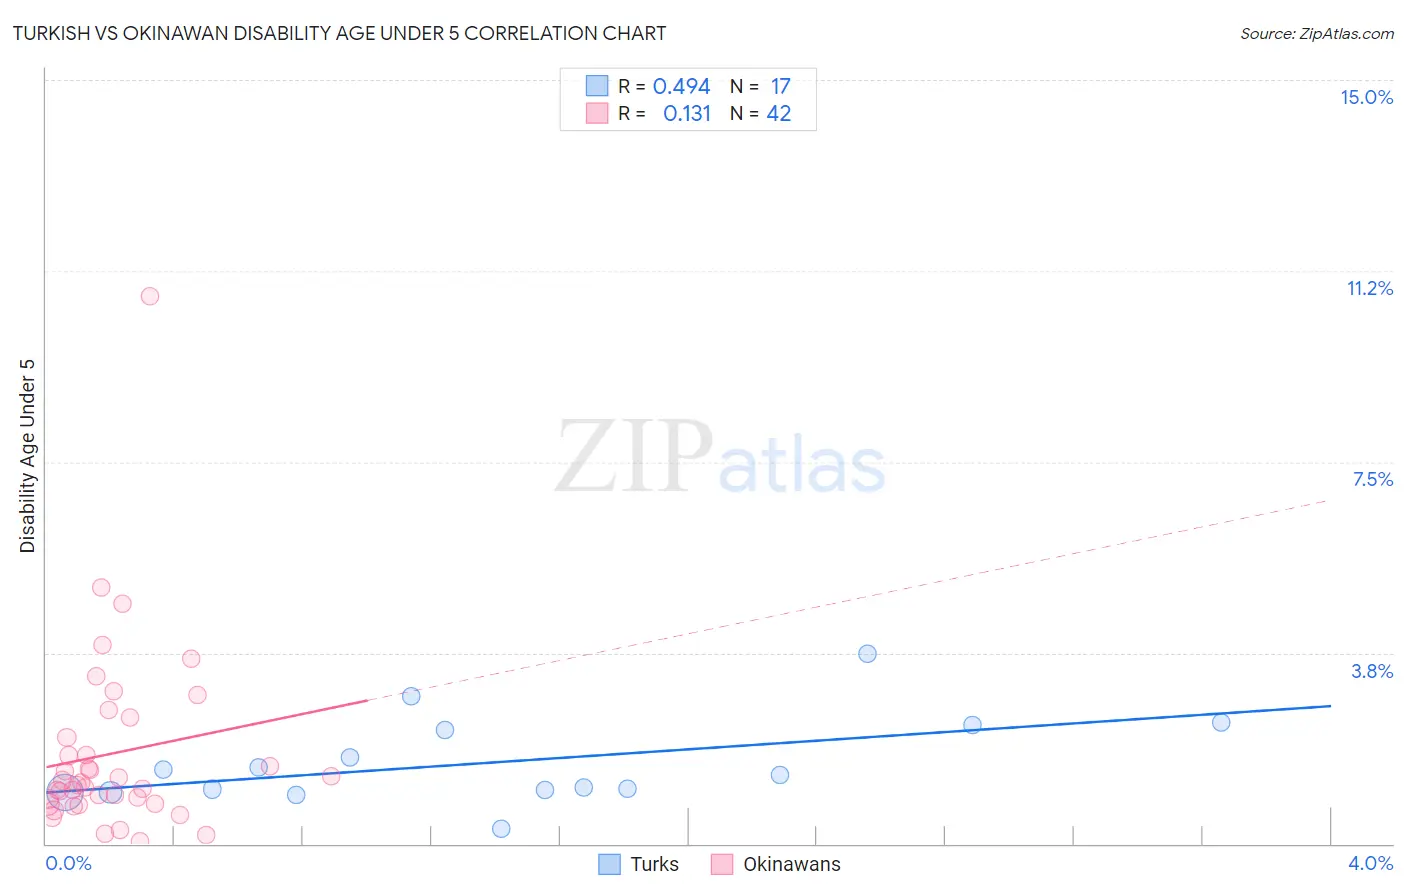
Turkish vs Okinawan Disability Age Under 5 Correlation Chart
The statistical analysis conducted on geographies consisting of 161,432,303 people shows a moderate positive correlation between the proportion of Turks and percentage of population with a disability under the age of 5 in the United States with a correlation coefficient (R) of 0.494 and weighted average of 1.1%. Similarly, the statistical analysis conducted on geographies consisting of 59,482,262 people shows a poor positive correlation between the proportion of Okinawans and percentage of population with a disability under the age of 5 in the United States with a correlation coefficient (R) of 0.131 and weighted average of 1.1%, a difference of 0.47%.
Disability Age Under 5 Correlation Summary
| Measurement | Turkish | Okinawan |
| Minimum | 0.31% | 0.058% |
| Maximum | 3.7% | 10.8% |
| Range | 3.4% | 10.7% |
| Mean | 1.6% | 1.8% |
| Median | 1.4% | 1.2% |
| Interquartile 25% (IQ1) | 1.0% | 0.80% |
| Interquartile 75% (IQ3) | 2.3% | 2.1% |
| Interquartile Range (IQR) | 1.2% | 1.3% |
| Standard Deviation (Sample) | 0.86% | 1.8% |
| Standard Deviation (Population) | 0.83% | 1.8% |
Demographics Similar to Turks and Okinawans by Disability Age Under 5
In terms of disability age under 5, the demographic groups most similar to Turks are Immigrants from Trinidad and Tobago (1.1%, a difference of 0.020%), Hmong (1.1%, a difference of 0.040%), West Indian (1.1%, a difference of 0.060%), Immigrants from Jordan (1.1%, a difference of 0.11%), and Immigrants from Syria (1.1%, a difference of 0.12%). Similarly, the demographic groups most similar to Okinawans are Ugandan (1.1%, a difference of 0.020%), Immigrants from Dominican Republic (1.1%, a difference of 0.040%), Sudanese (1.1%, a difference of 0.13%), Immigrants from Zaire (1.1%, a difference of 0.20%), and Ethiopian (1.1%, a difference of 0.32%).
| Demographics | Rating | Rank | Disability Age Under 5 |
| Immigrants | Sri Lanka | 98.5 /100 | #73 | Exceptional 1.1% |
| Jordanians | 98.5 /100 | #74 | Exceptional 1.1% |
| Immigrants | Pakistan | 98.4 /100 | #75 | Exceptional 1.1% |
| Immigrants | Burma/Myanmar | 98.2 /100 | #76 | Exceptional 1.1% |
| Immigrants | Denmark | 98.1 /100 | #77 | Exceptional 1.1% |
| West Indians | 98.0 /100 | #78 | Exceptional 1.1% |
| Hmong | 98.0 /100 | #79 | Exceptional 1.1% |
| Immigrants | Trinidad and Tobago | 98.0 /100 | #80 | Exceptional 1.1% |
| Turks | 98.0 /100 | #81 | Exceptional 1.1% |
| Immigrants | Jordan | 97.9 /100 | #82 | Exceptional 1.1% |
| Immigrants | Syria | 97.9 /100 | #83 | Exceptional 1.1% |
| Immigrants | Zaire | 97.8 /100 | #84 | Exceptional 1.1% |
| Sudanese | 97.7 /100 | #85 | Exceptional 1.1% |
| Okinawans | 97.6 /100 | #86 | Exceptional 1.1% |
| Ugandans | 97.5 /100 | #87 | Exceptional 1.1% |
| Immigrants | Dominican Republic | 97.5 /100 | #88 | Exceptional 1.1% |
| Ethiopians | 97.2 /100 | #89 | Exceptional 1.1% |
| Chinese | 97.2 /100 | #90 | Exceptional 1.1% |
| Albanians | 97.2 /100 | #91 | Exceptional 1.1% |
| Immigrants | Cuba | 97.0 /100 | #92 | Exceptional 1.1% |
| Spanish Americans | 96.9 /100 | #93 | Exceptional 1.1% |