South American Indian vs Immigrants from Middle Africa Ambulatory Disability
COMPARE
South American Indian
Immigrants from Middle Africa
Ambulatory Disability
Ambulatory Disability Comparison
South American Indians
Immigrants from Middle Africa
5.9%
AMBULATORY DISABILITY
94.8/ 100
METRIC RATING
115th/ 347
METRIC RANK
5.9%
AMBULATORY DISABILITY
92.2/ 100
METRIC RATING
124th/ 347
METRIC RANK
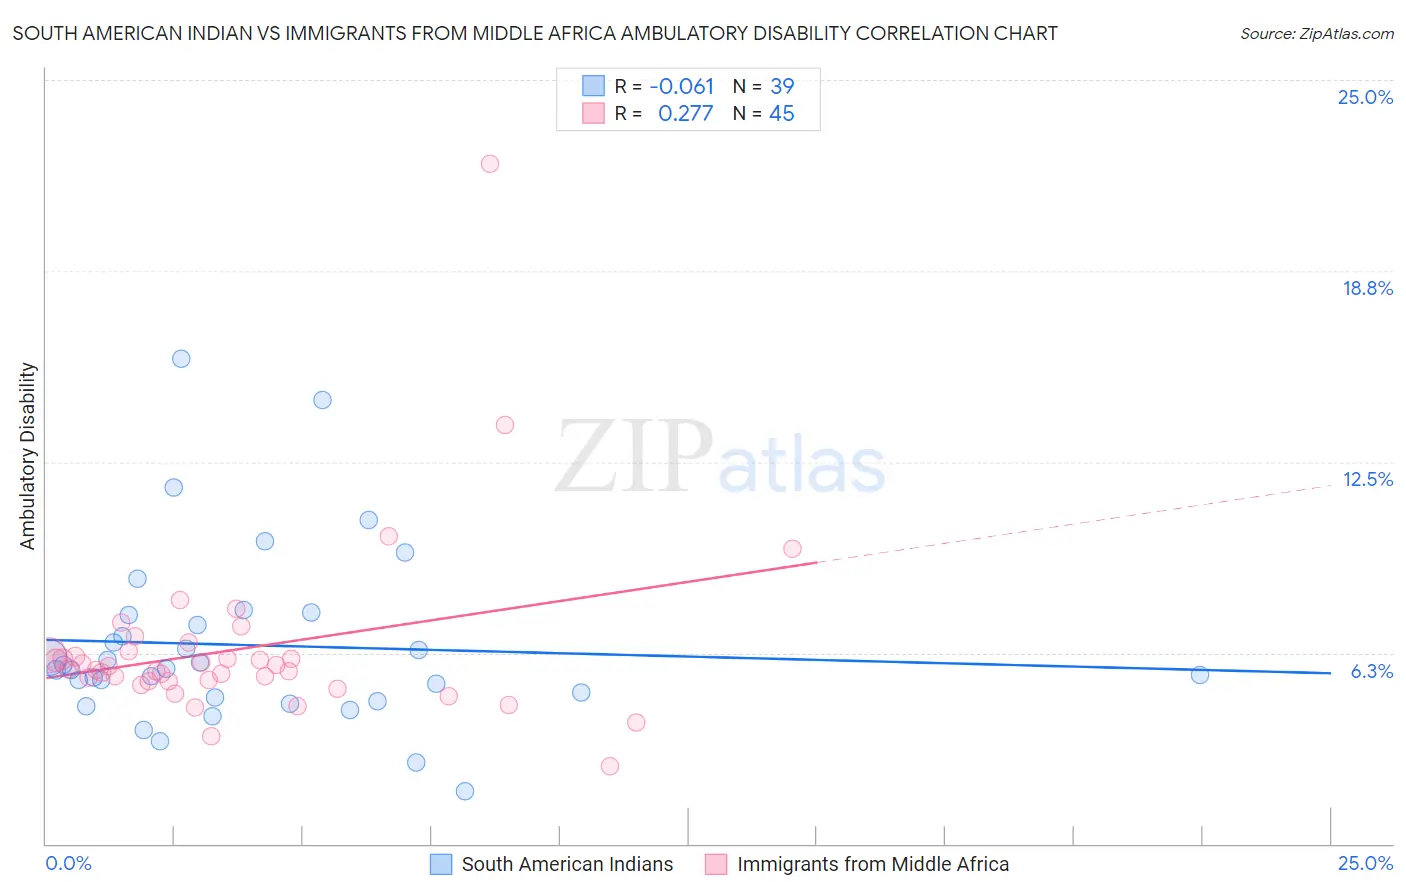
South American Indian vs Immigrants from Middle Africa Ambulatory Disability Correlation Chart
The statistical analysis conducted on geographies consisting of 164,560,869 people shows a slight negative correlation between the proportion of South American Indians and percentage of population with ambulatory disability in the United States with a correlation coefficient (R) of -0.061 and weighted average of 5.9%. Similarly, the statistical analysis conducted on geographies consisting of 202,691,189 people shows a weak positive correlation between the proportion of Immigrants from Middle Africa and percentage of population with ambulatory disability in the United States with a correlation coefficient (R) of 0.277 and weighted average of 5.9%, a difference of 0.58%.
Ambulatory Disability Correlation Summary
| Measurement | South American Indian | Immigrants from Middle Africa |
| Minimum | 1.7% | 2.5% |
| Maximum | 15.9% | 22.3% |
| Range | 14.2% | 19.7% |
| Mean | 6.5% | 6.4% |
| Median | 5.7% | 5.7% |
| Interquartile 25% (IQ1) | 4.8% | 5.3% |
| Interquartile 75% (IQ3) | 7.5% | 6.2% |
| Interquartile Range (IQR) | 2.7% | 0.93% |
| Standard Deviation (Sample) | 2.9% | 3.0% |
| Standard Deviation (Population) | 2.9% | 3.0% |
Demographics Similar to South American Indians and Immigrants from Middle Africa by Ambulatory Disability
In terms of ambulatory disability, the demographic groups most similar to South American Indians are Immigrants from Africa (5.9%, a difference of 0.010%), Immigrants from Poland (5.9%, a difference of 0.21%), Immigrants from Uruguay (5.9%, a difference of 0.26%), Immigrants from South Eastern Asia (5.9%, a difference of 0.29%), and Russian (5.9%, a difference of 0.33%). Similarly, the demographic groups most similar to Immigrants from Middle Africa are Immigrants from Russia (5.9%, a difference of 0.040%), Costa Rican (5.9%, a difference of 0.060%), Icelander (5.9%, a difference of 0.060%), Korean (5.9%, a difference of 0.12%), and Estonian (5.9%, a difference of 0.13%).
| Demographics | Rating | Rank | Ambulatory Disability |
| Immigrants | Netherlands | 97.1 /100 | #109 | Exceptional 5.8% |
| Immigrants | Colombia | 96.7 /100 | #110 | Exceptional 5.8% |
| Danes | 96.6 /100 | #111 | Exceptional 5.8% |
| South Africans | 96.3 /100 | #112 | Exceptional 5.9% |
| Immigrants | Uruguay | 95.6 /100 | #113 | Exceptional 5.9% |
| Immigrants | Poland | 95.4 /100 | #114 | Exceptional 5.9% |
| South American Indians | 94.8 /100 | #115 | Exceptional 5.9% |
| Immigrants | Africa | 94.7 /100 | #116 | Exceptional 5.9% |
| Immigrants | South Eastern Asia | 93.6 /100 | #117 | Exceptional 5.9% |
| Russians | 93.4 /100 | #118 | Exceptional 5.9% |
| Norwegians | 93.1 /100 | #119 | Exceptional 5.9% |
| Estonians | 92.9 /100 | #120 | Exceptional 5.9% |
| Costa Ricans | 92.6 /100 | #121 | Exceptional 5.9% |
| Icelanders | 92.6 /100 | #122 | Exceptional 5.9% |
| Immigrants | Russia | 92.4 /100 | #123 | Exceptional 5.9% |
| Immigrants | Middle Africa | 92.2 /100 | #124 | Exceptional 5.9% |
| Koreans | 91.6 /100 | #125 | Exceptional 5.9% |
| Arabs | 91.5 /100 | #126 | Exceptional 5.9% |
| Immigrants | Nigeria | 90.9 /100 | #127 | Exceptional 5.9% |
| Immigrants | Western Asia | 90.7 /100 | #128 | Exceptional 5.9% |
| Immigrants | Norway | 90.5 /100 | #129 | Exceptional 5.9% |