Chilean vs Czech Vision Disability
COMPARE
Chilean
Czech
Vision Disability
Vision Disability Comparison
Chileans
Czechs
2.1%
VISION DISABILITY
94.0/ 100
METRIC RATING
109th/ 347
METRIC RANK
2.1%
VISION DISABILITY
86.3/ 100
METRIC RATING
136th/ 347
METRIC RANK
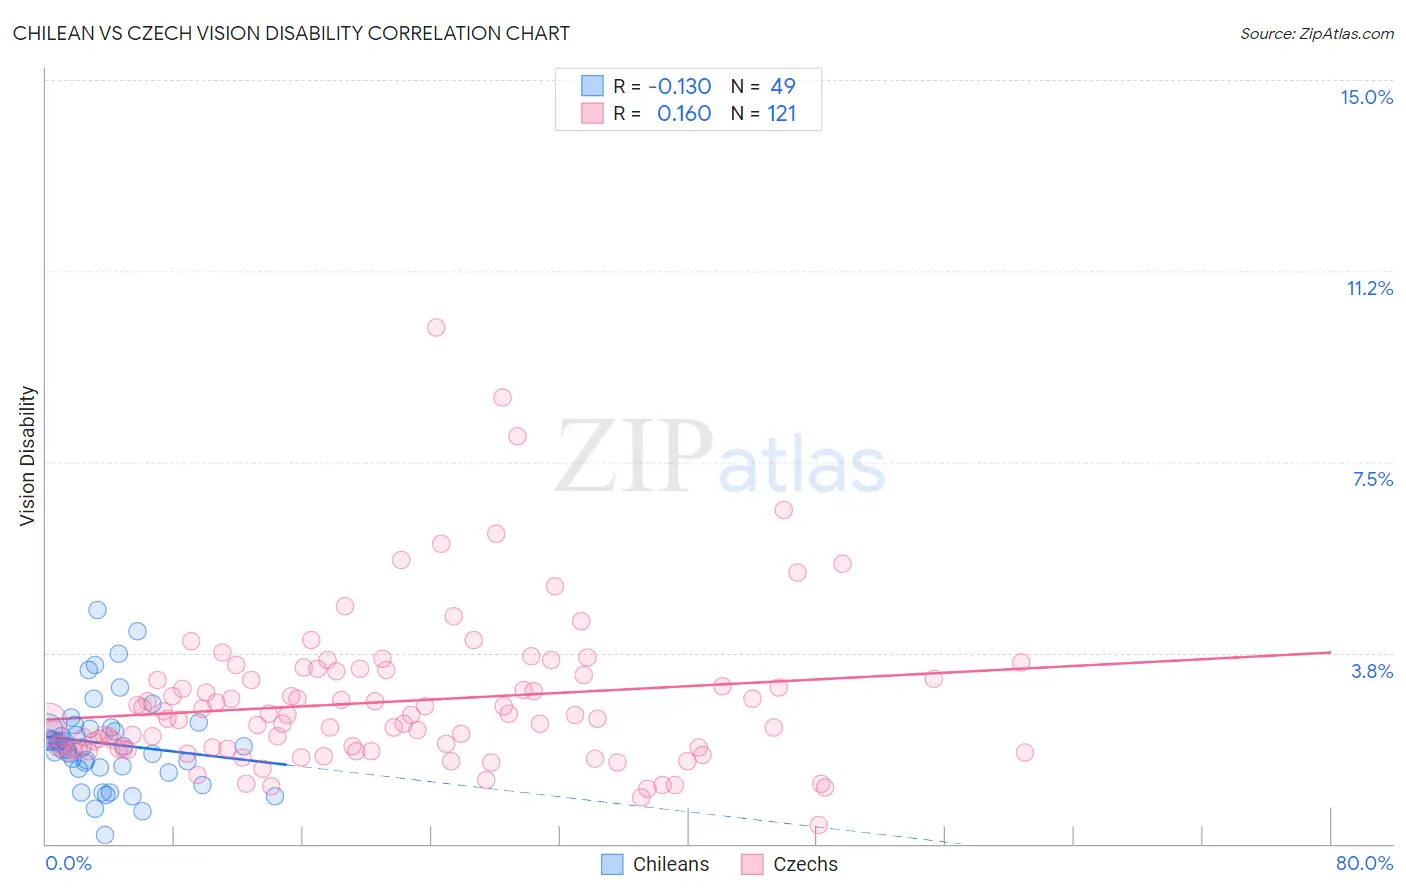
Chilean vs Czech Vision Disability Correlation Chart
The statistical analysis conducted on geographies consisting of 256,590,640 people shows a poor negative correlation between the proportion of Chileans and percentage of population with vision disability in the United States with a correlation coefficient (R) of -0.130 and weighted average of 2.1%. Similarly, the statistical analysis conducted on geographies consisting of 483,953,128 people shows a poor positive correlation between the proportion of Czechs and percentage of population with vision disability in the United States with a correlation coefficient (R) of 0.160 and weighted average of 2.1%, a difference of 1.5%.
Vision Disability Correlation Summary
| Measurement | Chilean | Czech |
| Minimum | 0.17% | 0.36% |
| Maximum | 4.6% | 10.1% |
| Range | 4.4% | 9.8% |
| Mean | 2.0% | 2.8% |
| Median | 1.9% | 2.4% |
| Interquartile 25% (IQ1) | 1.5% | 1.9% |
| Interquartile 75% (IQ3) | 2.3% | 3.3% |
| Interquartile Range (IQR) | 0.79% | 1.4% |
| Standard Deviation (Sample) | 0.89% | 1.5% |
| Standard Deviation (Population) | 0.88% | 1.5% |
Similar Demographics by Vision Disability
Demographics Similar to Chileans by Vision Disability
In terms of vision disability, the demographic groups most similar to Chileans are Korean (2.1%, a difference of 0.020%), Swedish (2.1%, a difference of 0.050%), Danish (2.1%, a difference of 0.050%), Immigrants from Armenia (2.1%, a difference of 0.070%), and Carpatho Rusyn (2.1%, a difference of 0.10%).
| Demographics | Rating | Rank | Vision Disability |
| Sri Lankans | 94.8 /100 | #102 | Exceptional 2.1% |
| Immigrants | Austria | 94.4 /100 | #103 | Exceptional 2.1% |
| Immigrants | Italy | 94.4 /100 | #104 | Exceptional 2.1% |
| Carpatho Rusyns | 94.3 /100 | #105 | Exceptional 2.1% |
| Swedes | 94.2 /100 | #106 | Exceptional 2.1% |
| Danes | 94.2 /100 | #107 | Exceptional 2.1% |
| Koreans | 94.1 /100 | #108 | Exceptional 2.1% |
| Chileans | 94.0 /100 | #109 | Exceptional 2.1% |
| Immigrants | Armenia | 93.8 /100 | #110 | Exceptional 2.1% |
| Peruvians | 93.5 /100 | #111 | Exceptional 2.1% |
| Immigrants | Denmark | 92.9 /100 | #112 | Exceptional 2.1% |
| Kenyans | 92.5 /100 | #113 | Exceptional 2.1% |
| Croatians | 92.3 /100 | #114 | Exceptional 2.1% |
| Immigrants | Vietnam | 92.2 /100 | #115 | Exceptional 2.1% |
| Ugandans | 92.2 /100 | #116 | Exceptional 2.1% |
Demographics Similar to Czechs by Vision Disability
In terms of vision disability, the demographic groups most similar to Czechs are Immigrants from South Eastern Asia (2.1%, a difference of 0.0%), Arab (2.1%, a difference of 0.010%), Vietnamese (2.1%, a difference of 0.050%), Venezuelan (2.1%, a difference of 0.12%), and Immigrants from Morocco (2.1%, a difference of 0.15%).
| Demographics | Rating | Rank | Vision Disability |
| Immigrants | Cameroon | 88.8 /100 | #129 | Excellent 2.1% |
| Immigrants | Kenya | 88.7 /100 | #130 | Excellent 2.1% |
| Immigrants | Hungary | 88.7 /100 | #131 | Excellent 2.1% |
| New Zealanders | 88.2 /100 | #132 | Excellent 2.1% |
| Syrians | 87.5 /100 | #133 | Excellent 2.1% |
| Venezuelans | 87.2 /100 | #134 | Excellent 2.1% |
| Vietnamese | 86.7 /100 | #135 | Excellent 2.1% |
| Czechs | 86.3 /100 | #136 | Excellent 2.1% |
| Immigrants | South Eastern Asia | 86.3 /100 | #137 | Excellent 2.1% |
| Arabs | 86.3 /100 | #138 | Excellent 2.1% |
| Immigrants | Morocco | 85.2 /100 | #139 | Excellent 2.1% |
| Immigrants | Netherlands | 84.2 /100 | #140 | Excellent 2.1% |
| Sierra Leoneans | 84.1 /100 | #141 | Excellent 2.1% |
| South Americans | 82.8 /100 | #142 | Excellent 2.1% |
| Immigrants | Sierra Leone | 82.8 /100 | #143 | Excellent 2.1% |