Central American Indian vs Alaska Native Ambulatory Disability
COMPARE
Central American Indian
Alaska Native
Ambulatory Disability
Ambulatory Disability Comparison
Central American Indians
Alaska Natives
7.2%
AMBULATORY DISABILITY
0.0/ 100
METRIC RATING
317th/ 347
METRIC RANK
6.2%
AMBULATORY DISABILITY
29.8/ 100
METRIC RATING
194th/ 347
METRIC RANK
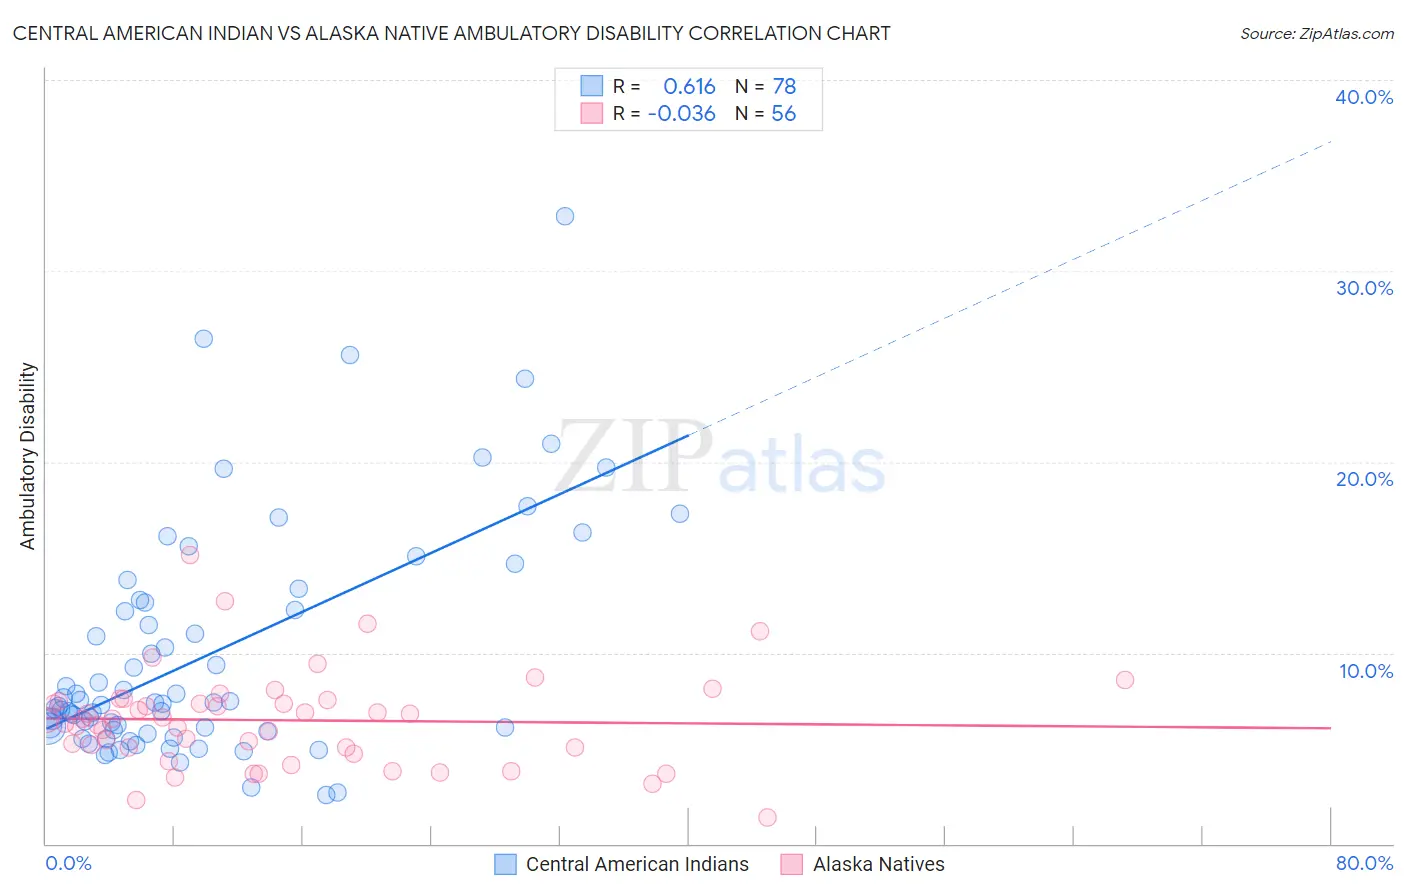
Central American Indian vs Alaska Native Ambulatory Disability Correlation Chart
The statistical analysis conducted on geographies consisting of 326,071,152 people shows a significant positive correlation between the proportion of Central American Indians and percentage of population with ambulatory disability in the United States with a correlation coefficient (R) of 0.616 and weighted average of 7.2%. Similarly, the statistical analysis conducted on geographies consisting of 76,753,099 people shows no correlation between the proportion of Alaska Natives and percentage of population with ambulatory disability in the United States with a correlation coefficient (R) of -0.036 and weighted average of 6.2%, a difference of 15.6%.
Ambulatory Disability Correlation Summary
| Measurement | Central American Indian | Alaska Native |
| Minimum | 2.6% | 1.4% |
| Maximum | 32.9% | 15.1% |
| Range | 30.3% | 13.8% |
| Mean | 9.9% | 6.5% |
| Median | 7.4% | 6.5% |
| Interquartile 25% (IQ1) | 6.0% | 5.0% |
| Interquartile 75% (IQ3) | 12.6% | 7.5% |
| Interquartile Range (IQR) | 6.7% | 2.5% |
| Standard Deviation (Sample) | 6.1% | 2.5% |
| Standard Deviation (Population) | 6.0% | 2.5% |
Similar Demographics by Ambulatory Disability
Demographics Similar to Central American Indians by Ambulatory Disability
In terms of ambulatory disability, the demographic groups most similar to Central American Indians are Immigrants from Dominican Republic (7.1%, a difference of 0.080%), Ottawa (7.2%, a difference of 0.090%), Shoshone (7.1%, a difference of 0.32%), Blackfeet (7.1%, a difference of 0.34%), and Immigrants from Yemen (7.1%, a difference of 0.36%).
| Demographics | Rating | Rank | Ambulatory Disability |
| Arapaho | 0.0 /100 | #310 | Tragic 7.1% |
| Cree | 0.0 /100 | #311 | Tragic 7.1% |
| Delaware | 0.0 /100 | #312 | Tragic 7.1% |
| Immigrants | Yemen | 0.0 /100 | #313 | Tragic 7.1% |
| Blackfeet | 0.0 /100 | #314 | Tragic 7.1% |
| Shoshone | 0.0 /100 | #315 | Tragic 7.1% |
| Immigrants | Dominican Republic | 0.0 /100 | #316 | Tragic 7.1% |
| Central American Indians | 0.0 /100 | #317 | Tragic 7.2% |
| Ottawa | 0.0 /100 | #318 | Tragic 7.2% |
| Dominicans | 0.0 /100 | #319 | Tragic 7.2% |
| Potawatomi | 0.0 /100 | #320 | Tragic 7.3% |
| Apache | 0.0 /100 | #321 | Tragic 7.4% |
| Osage | 0.0 /100 | #322 | Tragic 7.4% |
| Americans | 0.0 /100 | #323 | Tragic 7.4% |
| Navajo | 0.0 /100 | #324 | Tragic 7.5% |
Demographics Similar to Alaska Natives by Ambulatory Disability
In terms of ambulatory disability, the demographic groups most similar to Alaska Natives are Guatemalan (6.2%, a difference of 0.010%), Belgian (6.2%, a difference of 0.080%), Malaysian (6.2%, a difference of 0.10%), Immigrants from Western Europe (6.2%, a difference of 0.11%), and Immigrants from Guatemala (6.2%, a difference of 0.13%).
| Demographics | Rating | Rank | Ambulatory Disability |
| Carpatho Rusyns | 35.3 /100 | #187 | Fair 6.2% |
| British | 34.3 /100 | #188 | Fair 6.2% |
| Ukrainians | 34.0 /100 | #189 | Fair 6.2% |
| Immigrants | Western Africa | 33.4 /100 | #190 | Fair 6.2% |
| Immigrants | Guatemala | 31.9 /100 | #191 | Fair 6.2% |
| Immigrants | Western Europe | 31.6 /100 | #192 | Fair 6.2% |
| Guatemalans | 30.0 /100 | #193 | Fair 6.2% |
| Alaska Natives | 29.8 /100 | #194 | Fair 6.2% |
| Belgians | 28.6 /100 | #195 | Fair 6.2% |
| Malaysians | 28.2 /100 | #196 | Fair 6.2% |
| Poles | 26.3 /100 | #197 | Fair 6.2% |
| Immigrants | Bangladesh | 24.6 /100 | #198 | Fair 6.2% |
| Italians | 22.6 /100 | #199 | Fair 6.2% |
| Immigrants | Cambodia | 21.5 /100 | #200 | Fair 6.2% |
| Immigrants | Central America | 20.1 /100 | #201 | Fair 6.2% |