Chilean vs Immigrants from Zaire Female Disability
COMPARE
Chilean
Immigrants from Zaire
Female Disability
Female Disability Comparison
Chileans
Immigrants from Zaire
11.5%
FEMALE DISABILITY
99.8/ 100
METRIC RATING
72nd/ 347
METRIC RANK
12.3%
FEMALE DISABILITY
20.9/ 100
METRIC RATING
204th/ 347
METRIC RANK
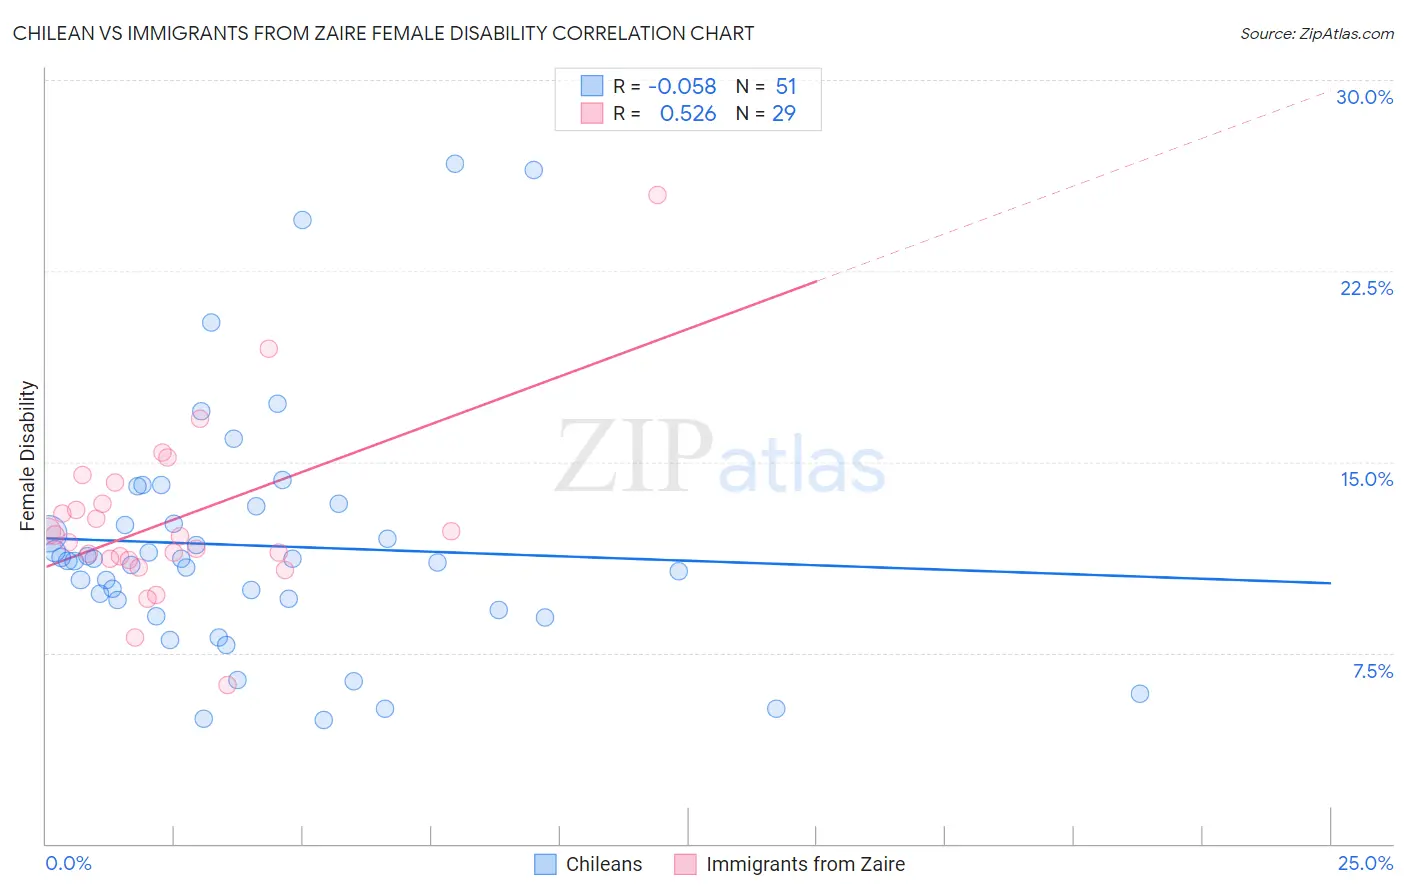
Chilean vs Immigrants from Zaire Female Disability Correlation Chart
The statistical analysis conducted on geographies consisting of 256,651,441 people shows a slight negative correlation between the proportion of Chileans and percentage of females with a disability in the United States with a correlation coefficient (R) of -0.058 and weighted average of 11.5%. Similarly, the statistical analysis conducted on geographies consisting of 107,254,316 people shows a substantial positive correlation between the proportion of Immigrants from Zaire and percentage of females with a disability in the United States with a correlation coefficient (R) of 0.526 and weighted average of 12.3%, a difference of 7.5%.
Female Disability Correlation Summary
| Measurement | Chilean | Immigrants from Zaire |
| Minimum | 4.8% | 6.2% |
| Maximum | 26.7% | 25.5% |
| Range | 21.8% | 19.3% |
| Mean | 11.7% | 12.7% |
| Median | 11.1% | 12.1% |
| Interquartile 25% (IQ1) | 9.2% | 11.2% |
| Interquartile 75% (IQ3) | 13.3% | 13.8% |
| Interquartile Range (IQR) | 4.1% | 2.6% |
| Standard Deviation (Sample) | 4.8% | 3.5% |
| Standard Deviation (Population) | 4.7% | 3.5% |
Similar Demographics by Female Disability
Demographics Similar to Chileans by Female Disability
In terms of female disability, the demographic groups most similar to Chileans are Immigrants from Switzerland (11.5%, a difference of 0.020%), Immigrants from Ireland (11.5%, a difference of 0.070%), Bhutanese (11.5%, a difference of 0.090%), Immigrants from Chile (11.5%, a difference of 0.11%), and Colombian (11.5%, a difference of 0.12%).
| Demographics | Rating | Rank | Female Disability |
| Immigrants | South America | 99.9 /100 | #65 | Exceptional 11.4% |
| Salvadorans | 99.8 /100 | #66 | Exceptional 11.5% |
| Immigrants | Vietnam | 99.8 /100 | #67 | Exceptional 11.5% |
| Immigrants | Northern Africa | 99.8 /100 | #68 | Exceptional 11.5% |
| Colombians | 99.8 /100 | #69 | Exceptional 11.5% |
| Immigrants | Chile | 99.8 /100 | #70 | Exceptional 11.5% |
| Immigrants | Ireland | 99.8 /100 | #71 | Exceptional 11.5% |
| Chileans | 99.8 /100 | #72 | Exceptional 11.5% |
| Immigrants | Switzerland | 99.8 /100 | #73 | Exceptional 11.5% |
| Bhutanese | 99.8 /100 | #74 | Exceptional 11.5% |
| Immigrants | Lebanon | 99.7 /100 | #75 | Exceptional 11.5% |
| Immigrants | Eritrea | 99.7 /100 | #76 | Exceptional 11.5% |
| Immigrants | Afghanistan | 99.7 /100 | #77 | Exceptional 11.5% |
| Immigrants | South Africa | 99.7 /100 | #78 | Exceptional 11.5% |
| Sierra Leoneans | 99.7 /100 | #79 | Exceptional 11.5% |
Demographics Similar to Immigrants from Zaire by Female Disability
In terms of female disability, the demographic groups most similar to Immigrants from Zaire are Immigrants from Barbados (12.3%, a difference of 0.020%), Immigrants from Grenada (12.4%, a difference of 0.020%), Somali (12.3%, a difference of 0.040%), Immigrants from Cuba (12.4%, a difference of 0.040%), and Croatian (12.4%, a difference of 0.040%).
| Demographics | Rating | Rank | Female Disability |
| Hondurans | 25.4 /100 | #197 | Fair 12.3% |
| Mexican American Indians | 24.9 /100 | #198 | Fair 12.3% |
| Immigrants | Trinidad and Tobago | 24.7 /100 | #199 | Fair 12.3% |
| Trinidadians and Tobagonians | 22.4 /100 | #200 | Fair 12.3% |
| Chinese | 22.1 /100 | #201 | Fair 12.3% |
| Somalis | 21.5 /100 | #202 | Fair 12.3% |
| Immigrants | Barbados | 21.1 /100 | #203 | Fair 12.3% |
| Immigrants | Zaire | 20.9 /100 | #204 | Fair 12.3% |
| Immigrants | Grenada | 20.5 /100 | #205 | Fair 12.4% |
| Immigrants | Cuba | 20.2 /100 | #206 | Fair 12.4% |
| Croatians | 20.2 /100 | #207 | Fair 12.4% |
| Basques | 17.5 /100 | #208 | Poor 12.4% |
| Mexicans | 15.7 /100 | #209 | Poor 12.4% |
| Swiss | 14.9 /100 | #210 | Poor 12.4% |
| Immigrants | Bosnia and Herzegovina | 14.8 /100 | #211 | Poor 12.4% |