Spanish American vs Immigrants from Cabo Verde Hearing Disability
COMPARE
Spanish American
Immigrants from Cabo Verde
Hearing Disability
Hearing Disability Comparison
Spanish Americans
Immigrants from Cabo Verde
4.0%
HEARING DISABILITY
0.0/ 100
METRIC RATING
316th/ 347
METRIC RANK
3.0%
HEARING DISABILITY
56.9/ 100
METRIC RATING
170th/ 347
METRIC RANK
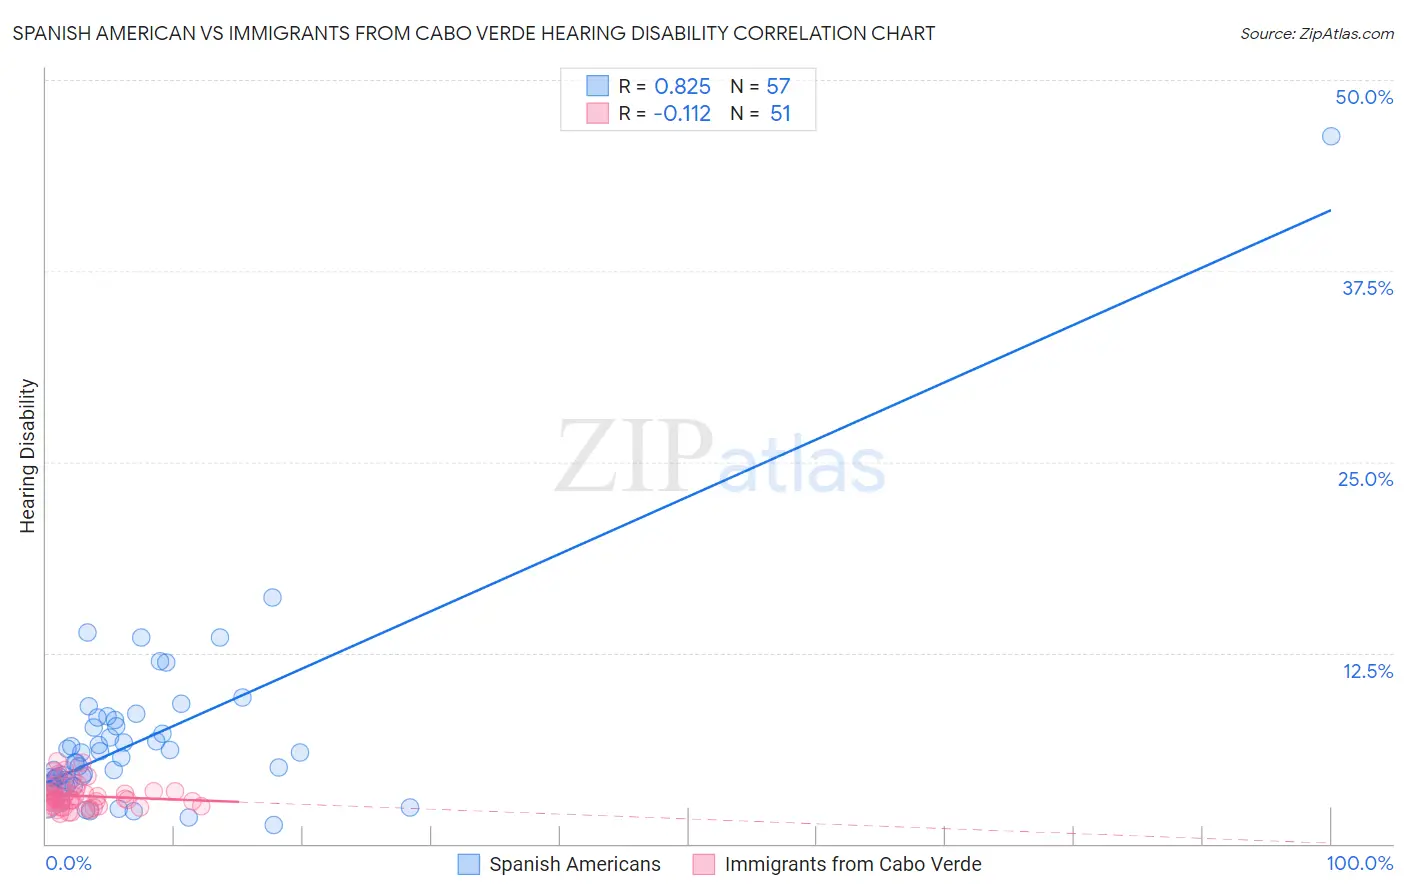
Spanish American vs Immigrants from Cabo Verde Hearing Disability Correlation Chart
The statistical analysis conducted on geographies consisting of 103,164,367 people shows a very strong positive correlation between the proportion of Spanish Americans and percentage of population with hearing disability in the United States with a correlation coefficient (R) of 0.825 and weighted average of 4.0%. Similarly, the statistical analysis conducted on geographies consisting of 38,139,523 people shows a poor negative correlation between the proportion of Immigrants from Cabo Verde and percentage of population with hearing disability in the United States with a correlation coefficient (R) of -0.112 and weighted average of 3.0%, a difference of 33.0%.
Hearing Disability Correlation Summary
| Measurement | Spanish American | Immigrants from Cabo Verde |
| Minimum | 1.3% | 2.0% |
| Maximum | 46.3% | 5.4% |
| Range | 45.0% | 3.4% |
| Mean | 6.8% | 3.1% |
| Median | 5.4% | 2.9% |
| Interquartile 25% (IQ1) | 4.0% | 2.5% |
| Interquartile 75% (IQ3) | 7.9% | 3.4% |
| Interquartile Range (IQR) | 3.9% | 0.92% |
| Standard Deviation (Sample) | 6.3% | 0.82% |
| Standard Deviation (Population) | 6.2% | 0.82% |
Similar Demographics by Hearing Disability
Demographics Similar to Spanish Americans by Hearing Disability
In terms of hearing disability, the demographic groups most similar to Spanish Americans are Comanche (4.0%, a difference of 0.13%), Puget Sound Salish (3.9%, a difference of 0.20%), Yakama (3.9%, a difference of 0.21%), Cheyenne (4.0%, a difference of 0.31%), and Hopi (3.9%, a difference of 0.38%).
| Demographics | Rating | Rank | Hearing Disability |
| Scotch-Irish | 0.0 /100 | #309 | Tragic 3.8% |
| Cree | 0.0 /100 | #310 | Tragic 3.8% |
| Americans | 0.0 /100 | #311 | Tragic 3.9% |
| Cajuns | 0.0 /100 | #312 | Tragic 3.9% |
| Hopi | 0.0 /100 | #313 | Tragic 3.9% |
| Yakama | 0.0 /100 | #314 | Tragic 3.9% |
| Puget Sound Salish | 0.0 /100 | #315 | Tragic 3.9% |
| Spanish Americans | 0.0 /100 | #316 | Tragic 4.0% |
| Comanche | 0.0 /100 | #317 | Tragic 4.0% |
| Cheyenne | 0.0 /100 | #318 | Tragic 4.0% |
| Chippewa | 0.0 /100 | #319 | Tragic 4.0% |
| Shoshone | 0.0 /100 | #320 | Tragic 4.0% |
| Paiute | 0.0 /100 | #321 | Tragic 4.1% |
| Seminole | 0.0 /100 | #322 | Tragic 4.1% |
| Apache | 0.0 /100 | #323 | Tragic 4.1% |
Demographics Similar to Immigrants from Cabo Verde by Hearing Disability
In terms of hearing disability, the demographic groups most similar to Immigrants from Cabo Verde are Immigrants from Ukraine (3.0%, a difference of 0.030%), Arab (3.0%, a difference of 0.070%), Armenian (3.0%, a difference of 0.090%), Immigrants from Greece (3.0%, a difference of 0.10%), and Immigrants from Eastern Europe (3.0%, a difference of 0.11%).
| Demographics | Rating | Rank | Hearing Disability |
| Immigrants | Central America | 64.9 /100 | #163 | Good 3.0% |
| Immigrants | Cambodia | 64.8 /100 | #164 | Good 3.0% |
| Immigrants | Zimbabwe | 64.2 /100 | #165 | Good 3.0% |
| Immigrants | South Eastern Asia | 62.9 /100 | #166 | Good 3.0% |
| Immigrants | Eastern Europe | 58.1 /100 | #167 | Average 3.0% |
| Immigrants | Greece | 57.9 /100 | #168 | Average 3.0% |
| Arabs | 57.6 /100 | #169 | Average 3.0% |
| Immigrants | Cabo Verde | 56.9 /100 | #170 | Average 3.0% |
| Immigrants | Ukraine | 56.6 /100 | #171 | Average 3.0% |
| Armenians | 56.0 /100 | #172 | Average 3.0% |
| Immigrants | Serbia | 51.1 /100 | #173 | Average 3.0% |
| Indonesians | 50.0 /100 | #174 | Average 3.0% |
| Immigrants | Romania | 48.4 /100 | #175 | Average 3.0% |
| Panamanians | 47.0 /100 | #176 | Average 3.0% |
| Immigrants | Philippines | 46.4 /100 | #177 | Average 3.0% |