Tohono O'odham vs Romanian Disability Age 18 to 34
COMPARE
Tohono O'odham
Romanian
Disability Age 18 to 34
Disability Age 18 to 34 Comparison
Tohono O'odham
Romanians
7.3%
DISABILITY AGE 18 TO 34
0.2/ 100
METRIC RATING
260th/ 347
METRIC RANK
6.6%
DISABILITY AGE 18 TO 34
39.5/ 100
METRIC RATING
181st/ 347
METRIC RANK
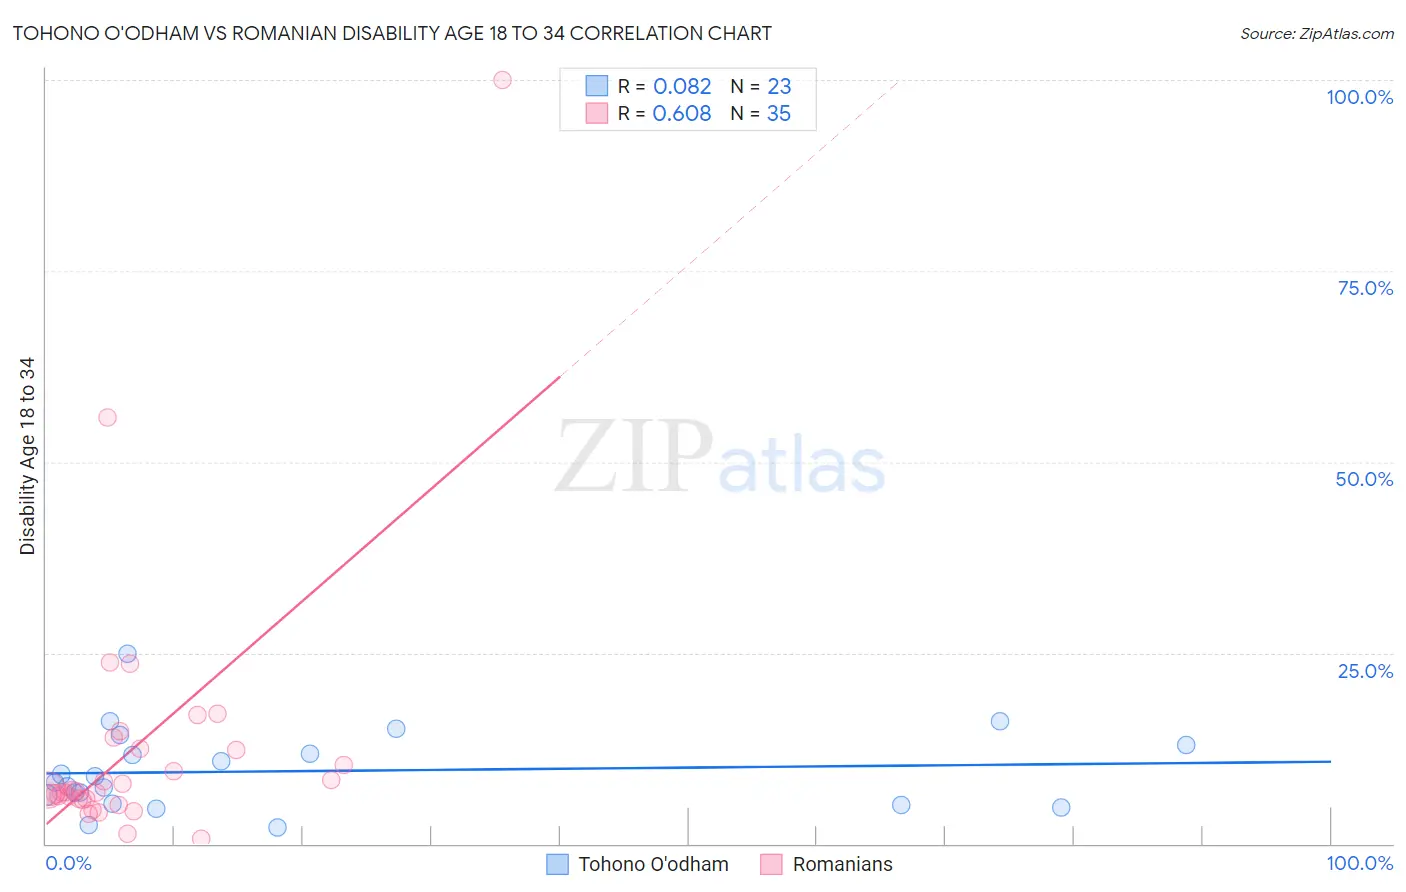
Tohono O'odham vs Romanian Disability Age 18 to 34 Correlation Chart
The statistical analysis conducted on geographies consisting of 58,690,000 people shows a slight positive correlation between the proportion of Tohono O'odham and percentage of population with a disability between the ages 18 and 35 in the United States with a correlation coefficient (R) of 0.082 and weighted average of 7.3%. Similarly, the statistical analysis conducted on geographies consisting of 376,995,004 people shows a significant positive correlation between the proportion of Romanians and percentage of population with a disability between the ages 18 and 35 in the United States with a correlation coefficient (R) of 0.608 and weighted average of 6.6%, a difference of 9.7%.
Disability Age 18 to 34 Correlation Summary
| Measurement | Tohono O'odham | Romanian |
| Minimum | 2.2% | 0.58% |
| Maximum | 24.9% | 100.0% |
| Range | 22.7% | 99.4% |
| Mean | 9.5% | 12.6% |
| Median | 8.1% | 7.0% |
| Interquartile 25% (IQ1) | 5.2% | 5.8% |
| Interquartile 75% (IQ3) | 13.0% | 12.5% |
| Interquartile Range (IQR) | 7.8% | 6.7% |
| Standard Deviation (Sample) | 5.3% | 18.0% |
| Standard Deviation (Population) | 5.2% | 17.7% |
Similar Demographics by Disability Age 18 to 34
Demographics Similar to Tohono O'odham by Disability Age 18 to 34
In terms of disability age 18 to 34, the demographic groups most similar to Tohono O'odham are Somali (7.3%, a difference of 0.060%), Immigrants from Micronesia (7.3%, a difference of 0.12%), Northern European (7.3%, a difference of 0.17%), Canadian (7.3%, a difference of 0.20%), and British (7.3%, a difference of 0.49%).
| Demographics | Rating | Rank | Disability Age 18 to 34 |
| Croatians | 0.5 /100 | #253 | Tragic 7.2% |
| Indonesians | 0.4 /100 | #254 | Tragic 7.2% |
| Immigrants | Germany | 0.4 /100 | #255 | Tragic 7.2% |
| Immigrants | Laos | 0.4 /100 | #256 | Tragic 7.2% |
| Czechs | 0.3 /100 | #257 | Tragic 7.2% |
| Immigrants | Micronesia | 0.3 /100 | #258 | Tragic 7.3% |
| Somalis | 0.2 /100 | #259 | Tragic 7.3% |
| Tohono O'odham | 0.2 /100 | #260 | Tragic 7.3% |
| Northern Europeans | 0.2 /100 | #261 | Tragic 7.3% |
| Canadians | 0.2 /100 | #262 | Tragic 7.3% |
| British | 0.2 /100 | #263 | Tragic 7.3% |
| Bermudans | 0.1 /100 | #264 | Tragic 7.3% |
| Slovenes | 0.1 /100 | #265 | Tragic 7.3% |
| German Russians | 0.1 /100 | #266 | Tragic 7.4% |
| Bangladeshis | 0.1 /100 | #267 | Tragic 7.4% |
Demographics Similar to Romanians by Disability Age 18 to 34
In terms of disability age 18 to 34, the demographic groups most similar to Romanians are Immigrants from Austria (6.6%, a difference of 0.010%), U.S. Virgin Islander (6.7%, a difference of 0.060%), Immigrants from Iraq (6.7%, a difference of 0.15%), Iraqi (6.7%, a difference of 0.16%), and Immigrants from Ghana (6.6%, a difference of 0.19%).
| Demographics | Rating | Rank | Disability Age 18 to 34 |
| Native Hawaiians | 50.0 /100 | #174 | Average 6.6% |
| Immigrants | Cambodia | 46.5 /100 | #175 | Average 6.6% |
| Immigrants | Africa | 45.9 /100 | #176 | Average 6.6% |
| Syrians | 44.3 /100 | #177 | Average 6.6% |
| Nigerians | 43.7 /100 | #178 | Average 6.6% |
| Immigrants | Ghana | 42.1 /100 | #179 | Average 6.6% |
| Immigrants | Austria | 39.6 /100 | #180 | Fair 6.6% |
| Romanians | 39.5 /100 | #181 | Fair 6.6% |
| U.S. Virgin Islanders | 38.6 /100 | #182 | Fair 6.7% |
| Immigrants | Iraq | 37.4 /100 | #183 | Fair 6.7% |
| Iraqis | 37.4 /100 | #184 | Fair 6.7% |
| Immigrants | Oceania | 35.4 /100 | #185 | Fair 6.7% |
| Yup'ik | 35.3 /100 | #186 | Fair 6.7% |
| Maltese | 34.8 /100 | #187 | Fair 6.7% |
| Immigrants | Cameroon | 34.5 /100 | #188 | Fair 6.7% |