Tohono O'odham vs Romanian 1st Grade
COMPARE
Tohono O'odham
Romanian
1st Grade
1st Grade Comparison
Tohono O'odham
Romanians
97.8%
1ST GRADE
23.2/ 100
METRIC RATING
199th/ 347
METRIC RANK
98.2%
1ST GRADE
97.8/ 100
METRIC RATING
101st/ 347
METRIC RANK
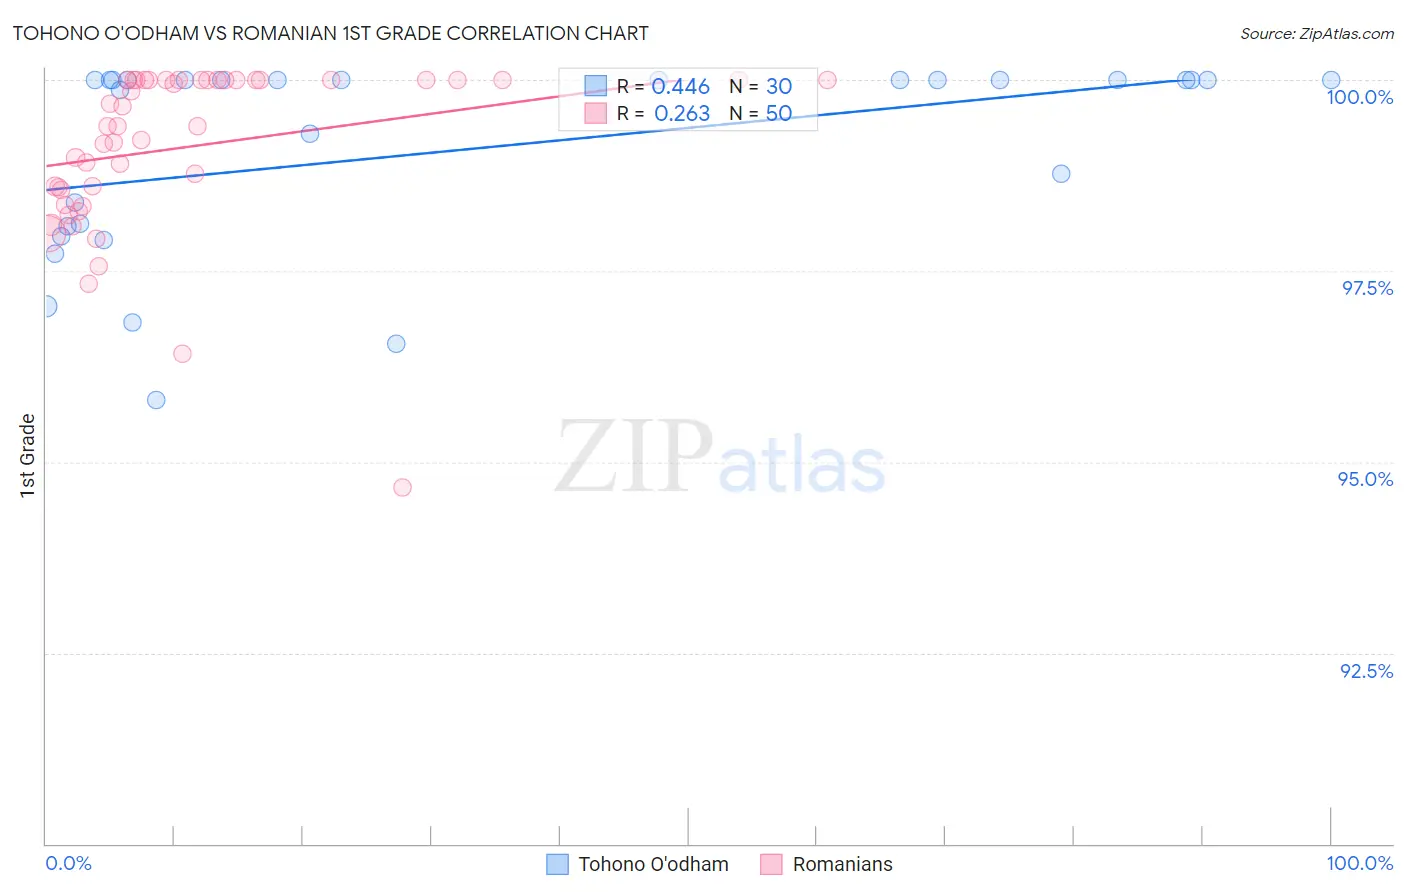
Tohono O'odham vs Romanian 1st Grade Correlation Chart
The statistical analysis conducted on geographies consisting of 58,723,100 people shows a moderate positive correlation between the proportion of Tohono O'odham and percentage of population with at least 1st grade education in the United States with a correlation coefficient (R) of 0.446 and weighted average of 97.8%. Similarly, the statistical analysis conducted on geographies consisting of 377,904,438 people shows a weak positive correlation between the proportion of Romanians and percentage of population with at least 1st grade education in the United States with a correlation coefficient (R) of 0.263 and weighted average of 98.2%, a difference of 0.39%.
1st Grade Correlation Summary
| Measurement | Tohono O'odham | Romanian |
| Minimum | 95.8% | 94.7% |
| Maximum | 100.0% | 100.0% |
| Range | 4.2% | 5.3% |
| Mean | 99.1% | 99.1% |
| Median | 100.0% | 99.4% |
| Interquartile 25% (IQ1) | 98.1% | 98.6% |
| Interquartile 75% (IQ3) | 100.0% | 100.0% |
| Interquartile Range (IQR) | 1.9% | 1.4% |
| Standard Deviation (Sample) | 1.3% | 1.1% |
| Standard Deviation (Population) | 1.3% | 1.1% |
Similar Demographics by 1st Grade
Demographics Similar to Tohono O'odham by 1st Grade
In terms of 1st grade, the demographic groups most similar to Tohono O'odham are Immigrants from Egypt (97.8%, a difference of 0.0%), Immigrants from Kenya (97.8%, a difference of 0.010%), Guamanian/Chamorro (97.8%, a difference of 0.010%), Yuman (97.8%, a difference of 0.010%), and Immigrants from Lebanon (97.8%, a difference of 0.010%).
| Demographics | Rating | Rank | 1st Grade |
| Paraguayans | 30.2 /100 | #192 | Fair 97.9% |
| Immigrants | Taiwan | 29.4 /100 | #193 | Fair 97.9% |
| Mongolians | 29.2 /100 | #194 | Fair 97.9% |
| Hawaiians | 28.8 /100 | #195 | Fair 97.9% |
| Immigrants | Kenya | 26.3 /100 | #196 | Fair 97.8% |
| Guamanians/Chamorros | 26.2 /100 | #197 | Fair 97.8% |
| Yuman | 24.4 /100 | #198 | Fair 97.8% |
| Tohono O'odham | 23.2 /100 | #199 | Fair 97.8% |
| Immigrants | Egypt | 22.6 /100 | #200 | Fair 97.8% |
| Immigrants | Lebanon | 20.1 /100 | #201 | Fair 97.8% |
| Immigrants | Ukraine | 19.2 /100 | #202 | Poor 97.8% |
| Immigrants | Southern Europe | 18.2 /100 | #203 | Poor 97.8% |
| Immigrants | Uganda | 18.2 /100 | #204 | Poor 97.8% |
| Immigrants | Chile | 17.7 /100 | #205 | Poor 97.8% |
| Immigrants | Albania | 17.3 /100 | #206 | Poor 97.8% |
Demographics Similar to Romanians by 1st Grade
In terms of 1st grade, the demographic groups most similar to Romanians are Cree (98.2%, a difference of 0.0%), Immigrants from Ireland (98.2%, a difference of 0.0%), Colville (98.2%, a difference of 0.010%), Pima (98.2%, a difference of 0.010%), and Basque (98.2%, a difference of 0.010%).
| Demographics | Rating | Rank | 1st Grade |
| South Africans | 98.6 /100 | #94 | Exceptional 98.2% |
| Immigrants | Germany | 98.5 /100 | #95 | Exceptional 98.2% |
| Cypriots | 98.3 /100 | #96 | Exceptional 98.2% |
| Immigrants | Nonimmigrants | 98.3 /100 | #97 | Exceptional 98.2% |
| Choctaw | 98.3 /100 | #98 | Exceptional 98.2% |
| Puget Sound Salish | 98.2 /100 | #99 | Exceptional 98.2% |
| Colville | 98.0 /100 | #100 | Exceptional 98.2% |
| Romanians | 97.8 /100 | #101 | Exceptional 98.2% |
| Cree | 97.8 /100 | #102 | Exceptional 98.2% |
| Immigrants | Ireland | 97.7 /100 | #103 | Exceptional 98.2% |
| Pima | 97.5 /100 | #104 | Exceptional 98.2% |
| Basques | 97.4 /100 | #105 | Exceptional 98.2% |
| Turks | 97.4 /100 | #106 | Exceptional 98.2% |
| Immigrants | Switzerland | 97.3 /100 | #107 | Exceptional 98.2% |
| Bhutanese | 97.3 /100 | #108 | Exceptional 98.2% |